 |
s7836-dn36The Rucami Argam Sketchbook |
Study of Totient Ratios and the Diminishing Return of Ever Larger Primes
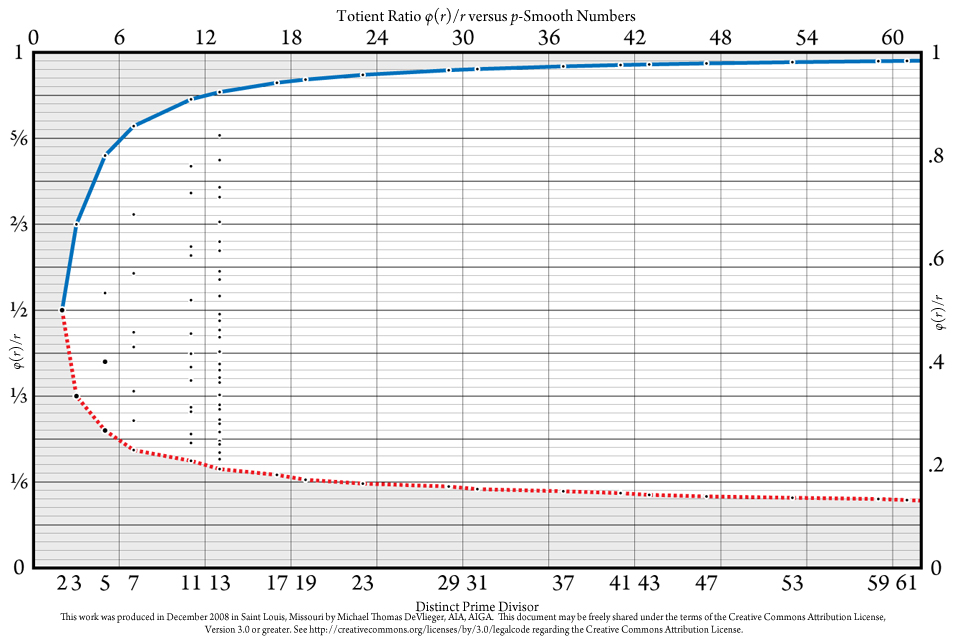
This chart plots the products of distinct prime divisors. The horizontal axis represents the value of the largest prime in the product, while the vertical axis represents the totient ratio, φ(r)/r. See a detail view of the products of the simplest primes.
In April 2019, I wrote Mathematica code that generates totient ratio graphs, plotting squarefree k with gpf(k) = prime(n) at (φ(r)/r, n). The above chart was produced in AutoCad and Illustrator, charting the primes amid nonprimes in the x axis, whereas the chart below plots the index of the prime. The chart that pertains to 0 ≤ n ≤ 12 appears below.

The chart below pertains to 0 ≤ n ≤ 100,000. Read more in this 2019 essay.

This page last modified Wednesday 10 April 2012.