OEIS A279818
The “paint sprayer” sequence, a sequence of David Sycamore, the plot of which furnished first by Scott R. Shannon.
Written by Michael Thomas De Vlieger, St. Louis, Missouri, 2020 1202.
Abstract.
This work intends to explain the striations seen in the plot of OEIS A279818.
Introduction.
We examine the sequence a(n) = OEIS A279818, a sequence that begins with a(1) = 1, thereafter, a(n + 1) = sum of digits of a(n), plus the sum of same digits arising in all prior terms; a(1) = 1. David Sycamore posed the sequence, with Scott R. Shannon contributing a plot and data.
The sequence begins:
1, 1, 2, 2, 4, 4, 8, 8, 16, 9, 9, 18, 28, 38, 43, 18, 53, 14, 22, 10, 7, 7, 14, 28, 68, 76, 39, 39, 51, 19, 55, 20, 14, 35, 43, 49, ...
a(2) = 1 since the digit sum of 1 is 1 and all the preceding digits 1 in the sequence amount to 0.
a(3) = 2 since the digit sum of the preceding term 1 is 1 and before this, there was a single digit 1 in the sequence.
a(4) = 2 since the digit sum of a(3) is 2, the first appearance of the digit 2 in the sequence.
a(5) = 4 since the digits in a(4) sum to 2, and there was 1 previous digit 2 in the sequence before this; 2 + 2 = 4.
...
a(10) = 9, since a(9) = 16, and there are two 1s and no 6s in the previous terms; 1 + 6 + 2 = 9.
etc.
We used Code 1.1 to generate 1200000 terms of a(n) so as to attempt to assure a series of local minima that covers the smallest million terms. The generation of this dataset required a couple hours*.
The sequence is not a permutation of the natural numbers; there are many repeated terms, and it seems that the sequence is missing the terms 3, 5, 6, etc. The sequences is self-referential but not recursive.
Records are set in a(n) for n in the following sequence R:
1, 3, 5, 7, 9, 12, 13, 14, 15, 17, 25, 26, 37, 38, 41, 57, 66, 68, 76, 79, 94, 103, 110, 124, 131, 135, 139, 140, 142, 159, 165, 166, 185, 187, 191, 195, ...
Apparent local minima appear in the following sequence S:
2, 4, 6, 22, 33, 45, 49, 50, 56, 60, 64, 74, 75, 97, 99, 105, 125, 161, 183, 214, 413, 495, 573, 681, 748, 768, 854, 2423, 2443, 2685, 3783, 9330, 15931, ...
Code 1.2 generates the maxima and local minima.
We derive S by reversal and negation of a dataset of a(n) that contains 1200000 terms. It is possible that there are terms for n exceeding 1200000 that prove smaller than some of the terms in S. There are very many records compared to the minima.
Numbers such that n = a(n) appear in the sequence Z, which has only 3 members for 1 ≤ n ≤ 1200000:
1, 8, 573.
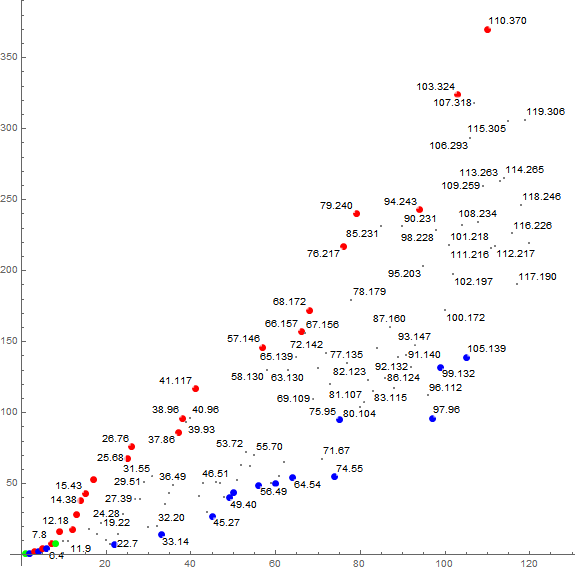
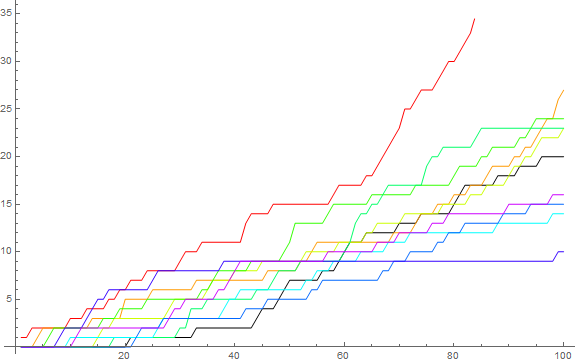
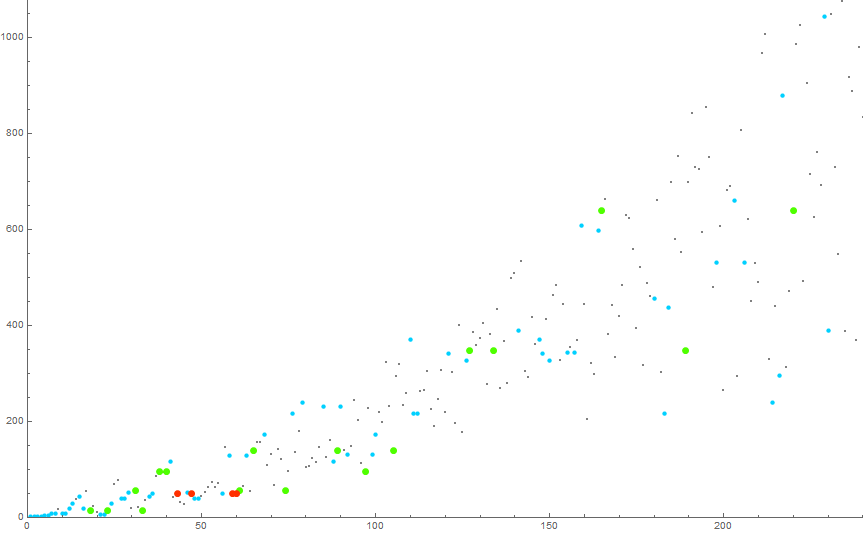
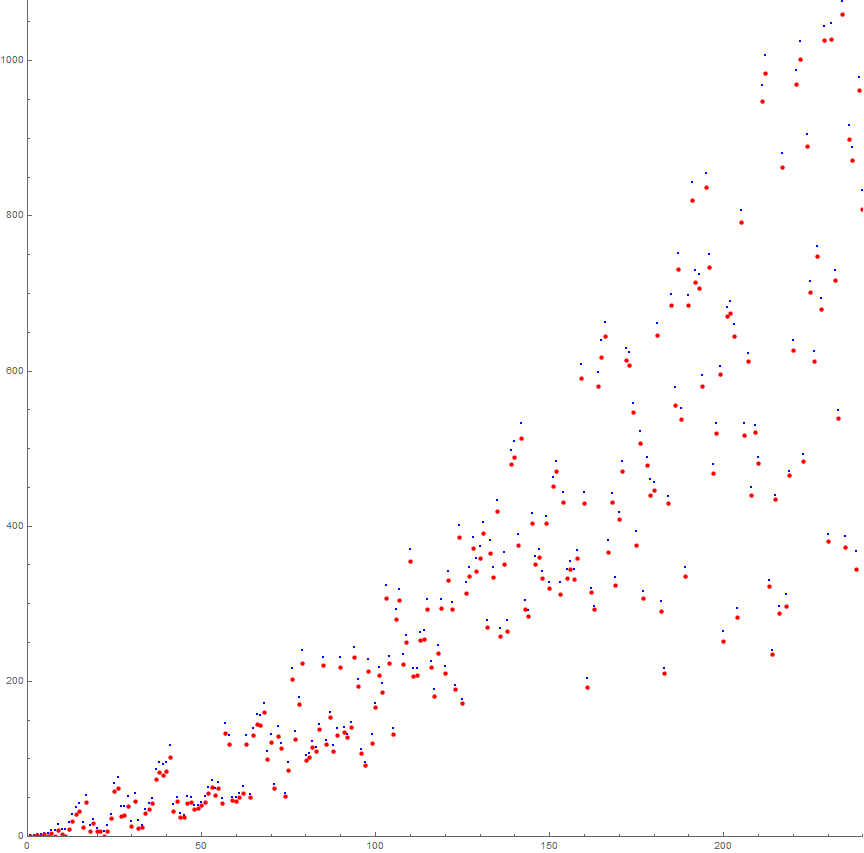
Figure 1.1 is a plot of a(n) for 1 ≤ n ≤ 120, showing n in R in red, n in S in blue, and n in Z in green, with all other data in small black points. Some of the data is annotated (x.y) = (n, a(n)). (Click the link to see this extended plot of 1200000 terms; see Code 1.3):
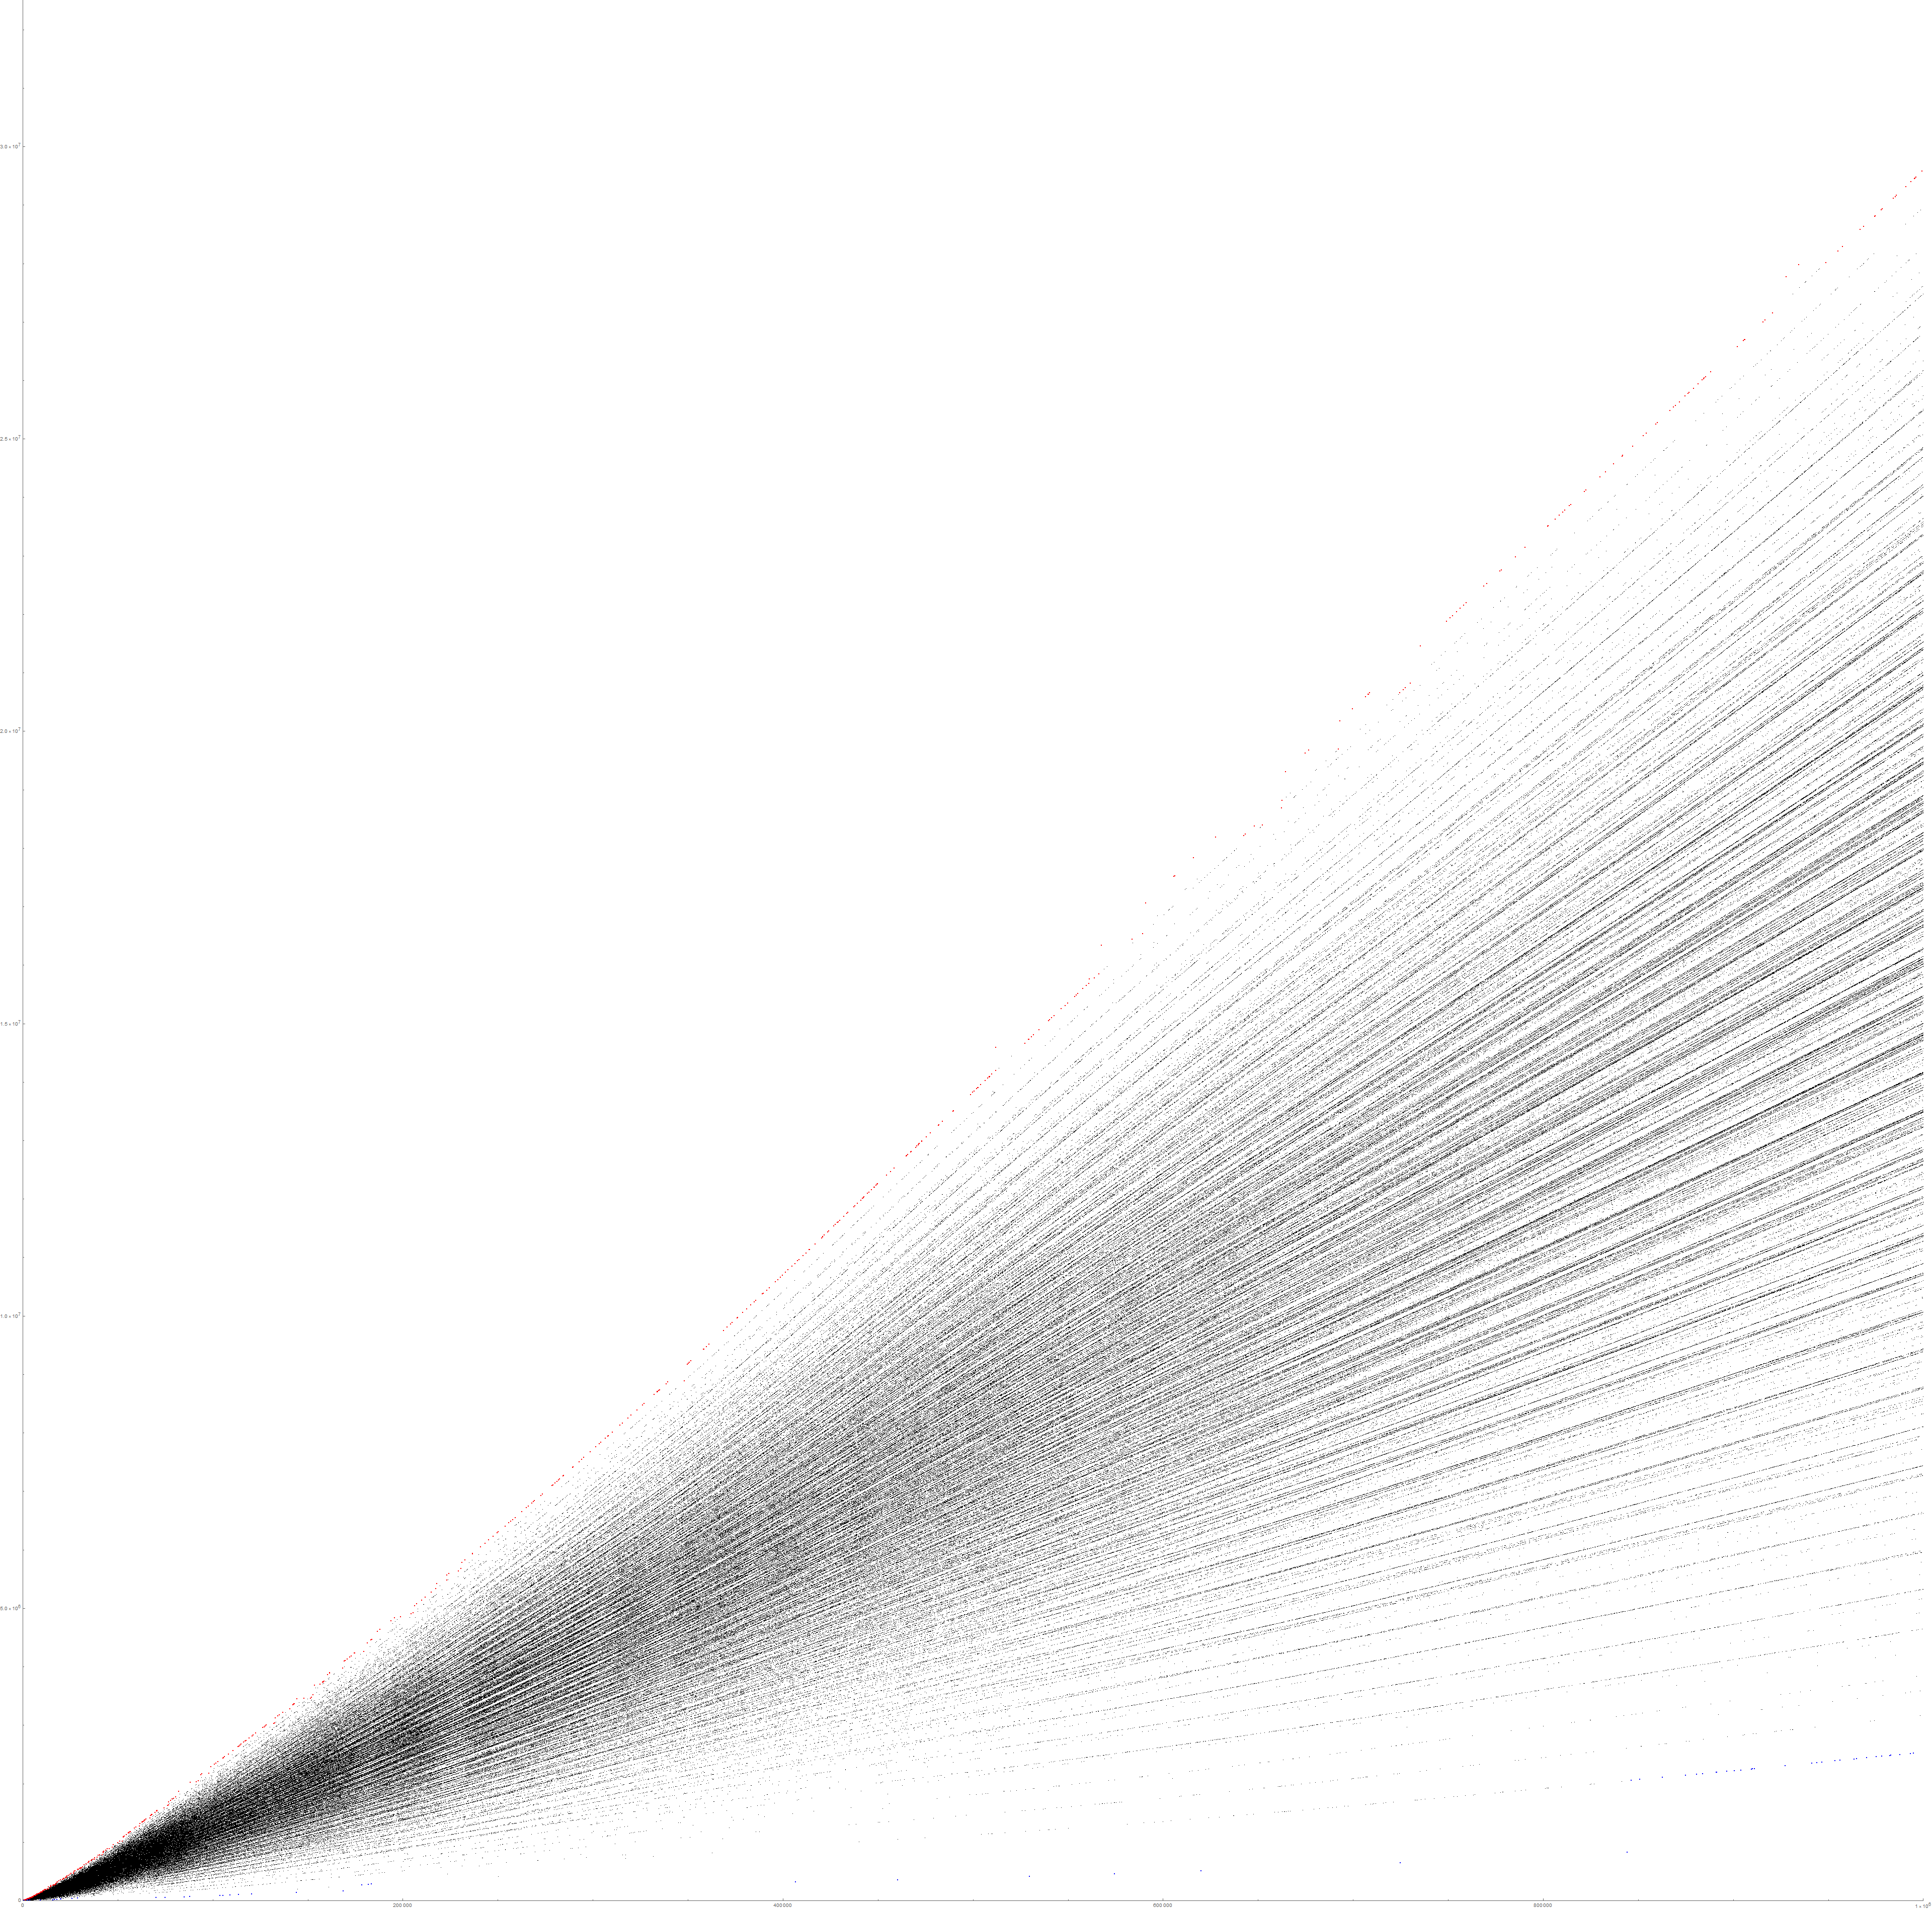
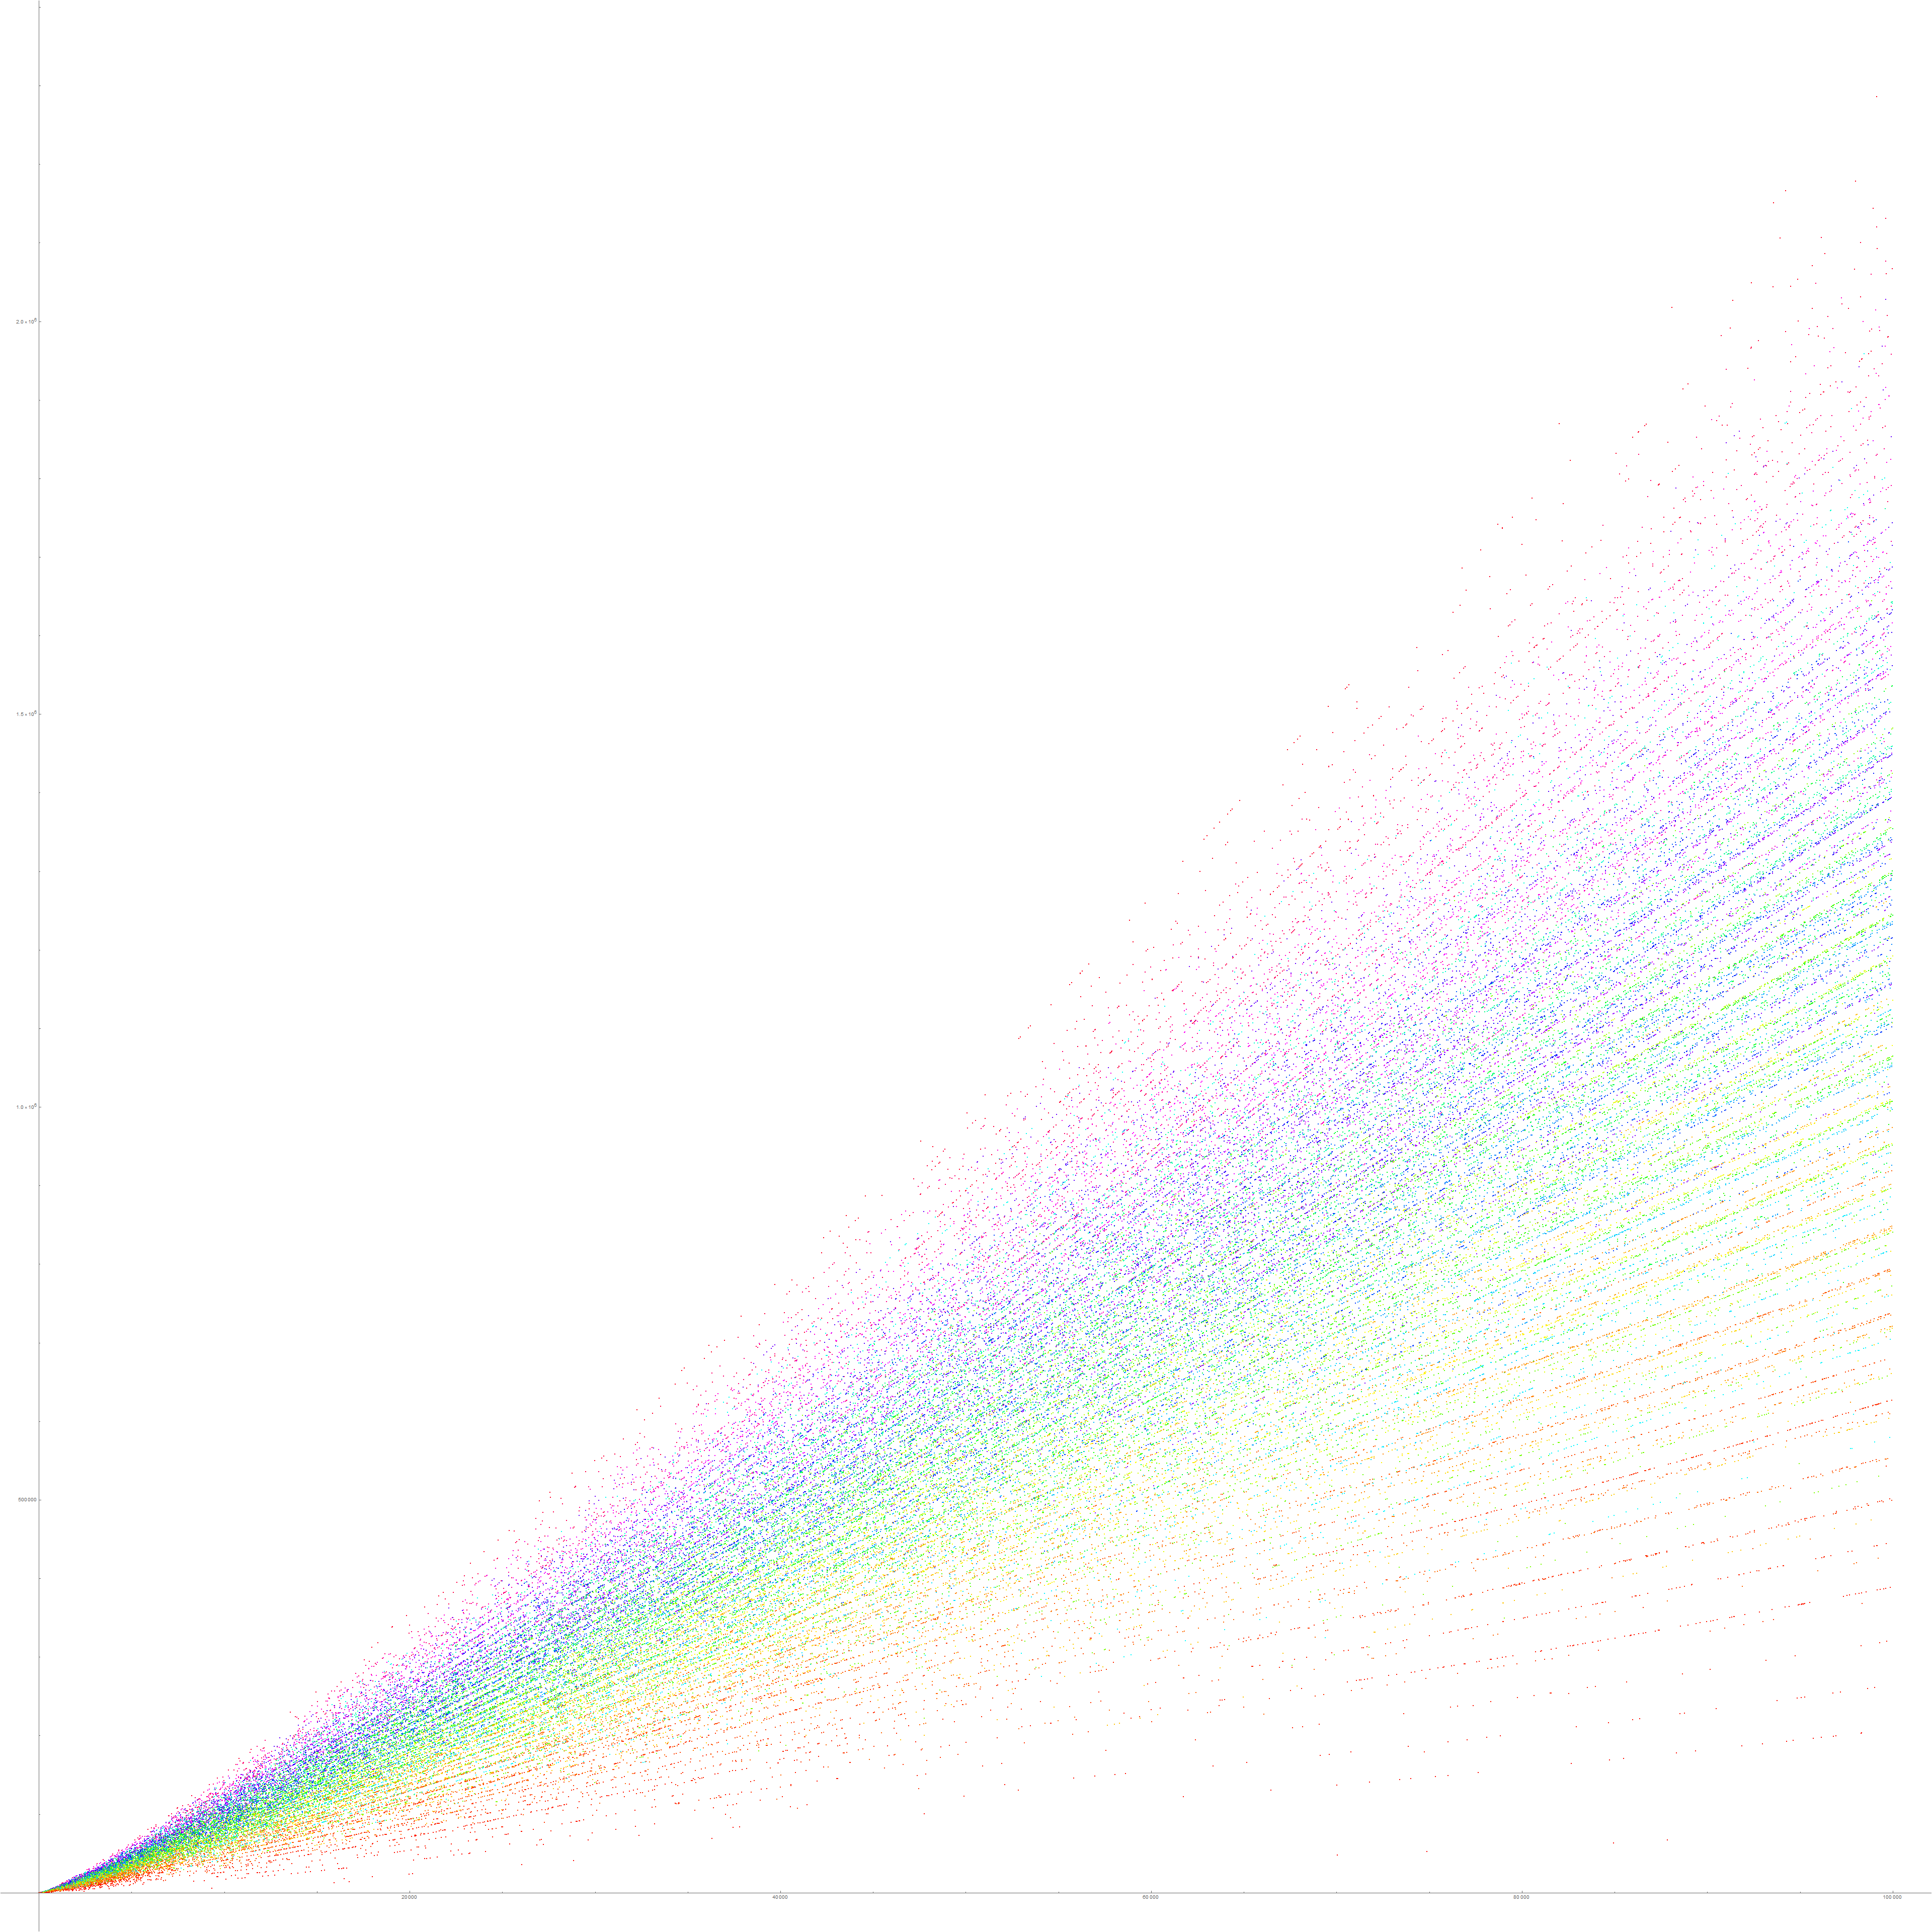
The notable thing about the plot of a(n) (especially visible in the extended plot) is a curious fan-like striation noted in the OEIS as a paint-sprayer pattern.
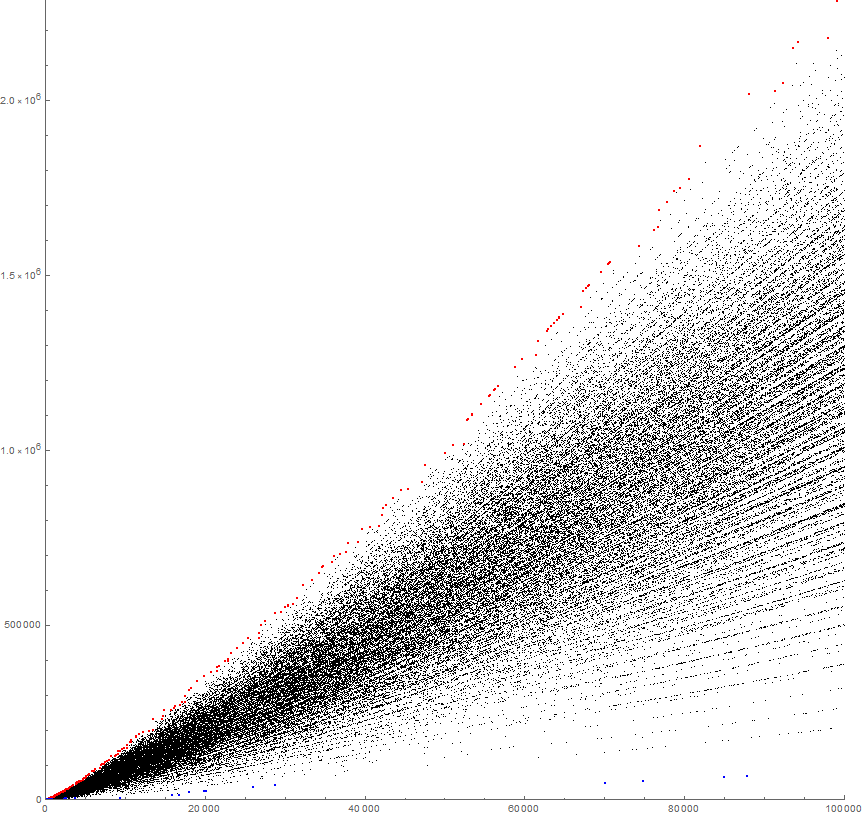
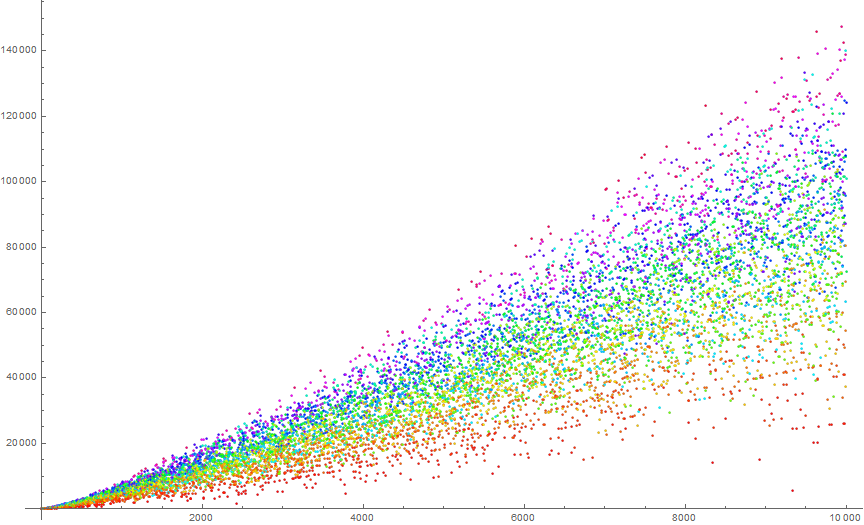
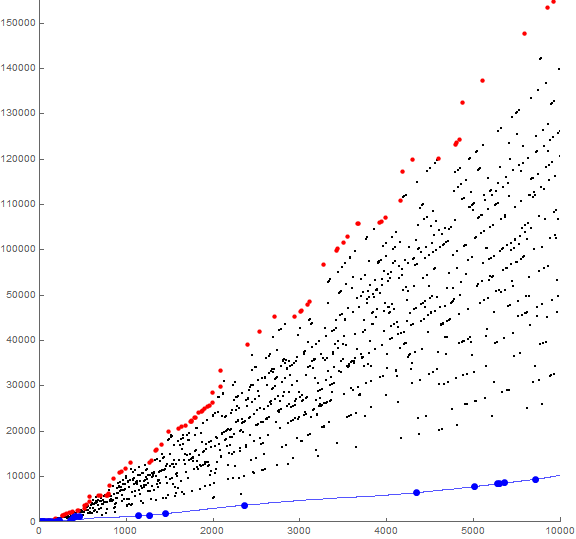
Figure 1.2 shows 100000 terms; the paint-sprayer appearance is evident at this scale (see Code 1.4).
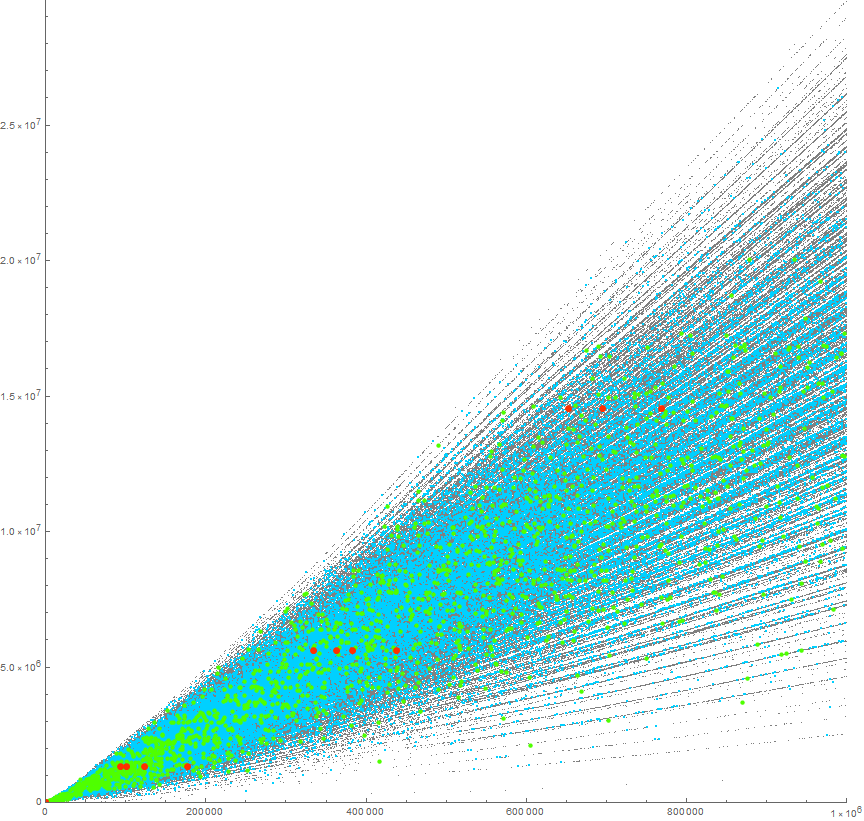
The question utlimately regards the pseudo-radial striations in the plot. A second question regards the “vertical avenues” of apparent negative space that seem to arise and are most apparent given a million terms, notably around n = 175000 and 220000. The striations appear to branch from one another as n increases, with new striations materializing notably among the records in R, but also among the apparent local minima in S. Overall the entire plot appears to have a slight curve upward as n increases.
Validation of the local minima.
Are we sure we cannot have terms m for n > 1200000 that are smaller than the largest “minimum”? Looking at the extended plot, we see that the “minima” trend along a low-lying line where the terms are generally such that n < a(n). For n = S(60) = 844277, a(844277) = 826778, while a(S(61)) = a(846254) = 2056410. Perhaps the list of indices of local minima is correct through S(60). Let t(d, n) be the function of the partial sum of the number of digits d in a(n) at index n. We may define a function f(n) that has the least possible value of the sum of digits arising in all prior terms, assuming that we have minimized the digital sum so as to only involve 1 nonzero digit d (i.e., that a(n − 1) is a repdigit or that same consists of at most two distinct digits 0 and nonzero d). After the first hundred terms the partial sums of d = 1, i.e., t(1, n) proves to offer the smallest addend to the digit sum. The sum of the previous occurrences of the digits in a(n − 1) is certainly the dominant addend for n > 100, which supports the notion that a(844277) = 826778 is just about as low as the function might go. Therefore we might expect the minima in S to be reliable if they meet or exceed t(1, n).
We can disregard digit d = 0 since zero is the additive identity and is multiplicatively nilpotent. The sum of all digits 0 that have appeared in the sequence amount to 0; when added to the digital sum of the last term, 0 does not change the sum. Therefore any digit 0 impacts neither the digital sum of the previous term, nor the partial sum of all digits d in the sequence that appear in the previous term.
Table 2.1 shows the difference M = a(S(i)) − f(S(i) − 1) for local minima a(S(i)), with D = digital sum of a(S(i) − 1). We derive “sum of same digits arising in all prior terms” via a(S(i)) − D.
i S(i) a(S(i)) a(S(i)-1) D a(S(i))-D f(S(i)-1) M
--------------------------------------------------------------
1* 2 1 1 1 0 0 0
2* 4 2 2 2 0 0 0
3* 6 4 4 4 0 0 0
4* 22 7 7 7 0 0 0
5 33 14 20 2 12 10 2
6 45 27 30 3 24 14 10
7 49 40 40 4 36 15 21
8 50 44 40 4 40 15 25
9 56 49 70 7 42 15 27
10 60 50 50 5 45 17 28
11 64 54 130 4 50 17 33
12 74 55 120 3 52 26 26
13 75 95 55 10 85 27 58
14 97 96 112 4 92 46 46
15 99 132 228 12 120 48 72
16 105 139 232 7 132 52 80
17 125 176 401 5 171 59 112
18 161 204 444 12 192 65 127
19 183 216 303 6 210 69 141
20 214 240 330 6 234 71 163
21 413 280 2022 6 274 225 49
22 495 386 2022 6 380 294 86
23 573 573 3030 6 567 337 230
24 681 732 3330 9 723 383 340
25 748 806 2202 6 800 409 391
26 768 1421 4101 6 1415 415 1000
27 854 1484 3111 6 1478 446 1032
28* 2423 1631 10101 3 1628 1628 0
29 2443 4484 13303 10 4474 1657 2817
30 2685 4486 11201 5 4481 1917 2564
31 3783 4773 30303 9 4764 2840 1924
32* 9330 5476 100001 2 5474 5474 0
33* 15931 12600 100011 3 12597 12597 0
34* 16749 13627 110011 4 13623 13623 0
35 17977 20080 220200 6 20074 15069 5005
36 19957 23548 200000 2 23546 17166 6380
37 20146 23876 220020 6 23870 17363 6507
38 26038 35906 200020 4 35902 22193 13709
39 28840 41134 202220 8 41126 24050 17076
40* 70044 47827 1010010 3 47824 47824 0
41* 74876 52254 1001110 4 52250 52250 0
42* 84954 63280 1010010 3 63277 63277 0
43* 87848 66762 1011101 5 66757 66757 0
44* 103792 87875 1100111 5 87870 87870 0
45* 105230 89833 1110011 5 89828 89828 0
46* 109034 95097 1110101 5 95092 95092 0
47* 113494 101281 1100100 3 101278 101278 0
48* 120361 110764 1101110 5 110759 110759 0
49* 144092 140889 1100000 2 140887 140887 0
50* 168592 165924 1100101 4 165920 165920 0
51 178343 270090 2220220 10 270080 174474 95606
52 181871 278234 2000020 4 278230 177481 100749
53 183514 281868 2200020 6 281862 178860 103002
54* 406718 322132 10001111 5 322127 322127 0
55* 460256 355986 10000011 3 355983 355983 0
56* 529823 411235 10010101 4 411231 411231 0
57* 574437 455603 11100000 3 455600 455600 0
58* 619893 508206 10110101 5 508201 508201 0
59* 724783 648911 11001111 6 648905 648905 0
60* 844277 826778 11011100 5 826773 826773 0
...
Note that the terms asterisked in Table 2.1 have M = 0, observing that the set of distinct digits in a(S(i) − 1) is either {1} or {0,1}. Indeed, we can validate S(i) for 1 ≤ i ≤ 60, since there can be no smaller term than f(n). Thus, the numbers in S(i) for i > 60 remain suspect until we generate more terms in a(n) and assure that they are truly indices of local minima, as M is large for all of these. Therefore we may designate the terms S(i) where i is asterisked (i.e., such that M = 0) as “base minima”. The following indices appear to designate base minima in a(n) for n ≤ 1200000:
2, 4, 6, 22, 2423, 9330, 15931, 16749, 70044, 74876, 84954, 87848, 103792, 105230, 109034, 113494, 120361, 144092, 168592, 406718, 460256, 529823, 574437, 619893, 724783, 844277, ...
For these indices, a(n) can be no smaller on account of the “sum of same digits arising in all prior terms”.
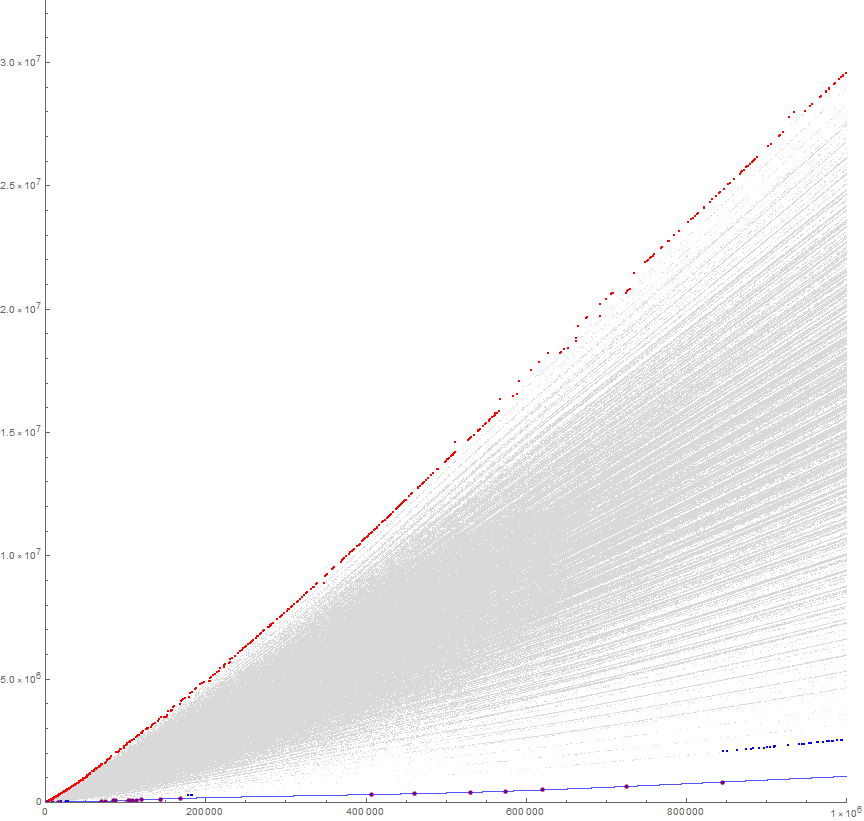
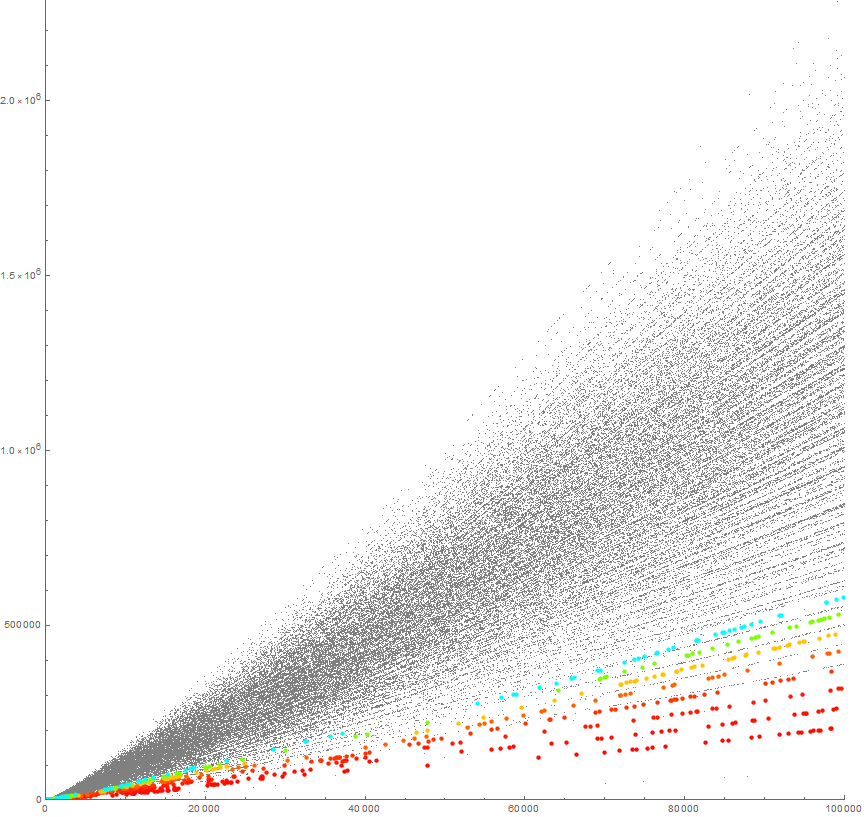
Figure 2.1 is a plot of 1 million terms of a(n) so as to accentuate maxima in red, the computed local minima in blue (even when perhaps not true local minima, e.g., the blue dots on the extreme right), and the base minima in purple. We plot f(n) in light blue, representing the very smallest a(n) may prove, provided a(n − 1) is a number that consists of at least one 1 and any number of zeros.
The partial sums of digits d arising in a(n).
Let c(d, n) be the number of digits d in a(n) and let t(d, n) be the partial sums of c(d, n). We see that t(d, n) furnishes f(n) for the following digits d:
2, 2, 2, 3, 3, 3, 3, 3, 3, 3, 3, 3, 3, 3, 5, 5, 5, 7, 7, 7, 7, 5, 5, 5, 5, 5, 5, 5, 5, 1, 1, 1, 1, 1, 1, 1, 1, 1, 1, 1, 1, 1, 1, 1, 1, 1, 1, 1, 1, 1, 1, 1, 1, 1, 1, 1, 1, 1, 1, 1, 1, 1, 1, 1, 1, 1, 1, 1, 1, 1, 2, 2, 1, 1, 1, 1, 1, 1, 1, 1, 1, 1, 1, 2, 2, 2, 1, 2, 2, 2, 2, 2, 2, 2, 2, 1, 1, 1, ...
Thereafter (for n ≥ 96), d = 1 indefinitely.
We can generate c(d, n) and t(d, n) via Code 3.1.
Figure 3.1 is a plot of t(d, n) for 1 ≤ n ≤ 100, and color function indicating d. We show d = 0 in black, d = 1 in red, and d = 9 in purple.
The data in this range appear to jumble, but taking in a wider dataset, we see a greater order among t(d, n) as n increases.
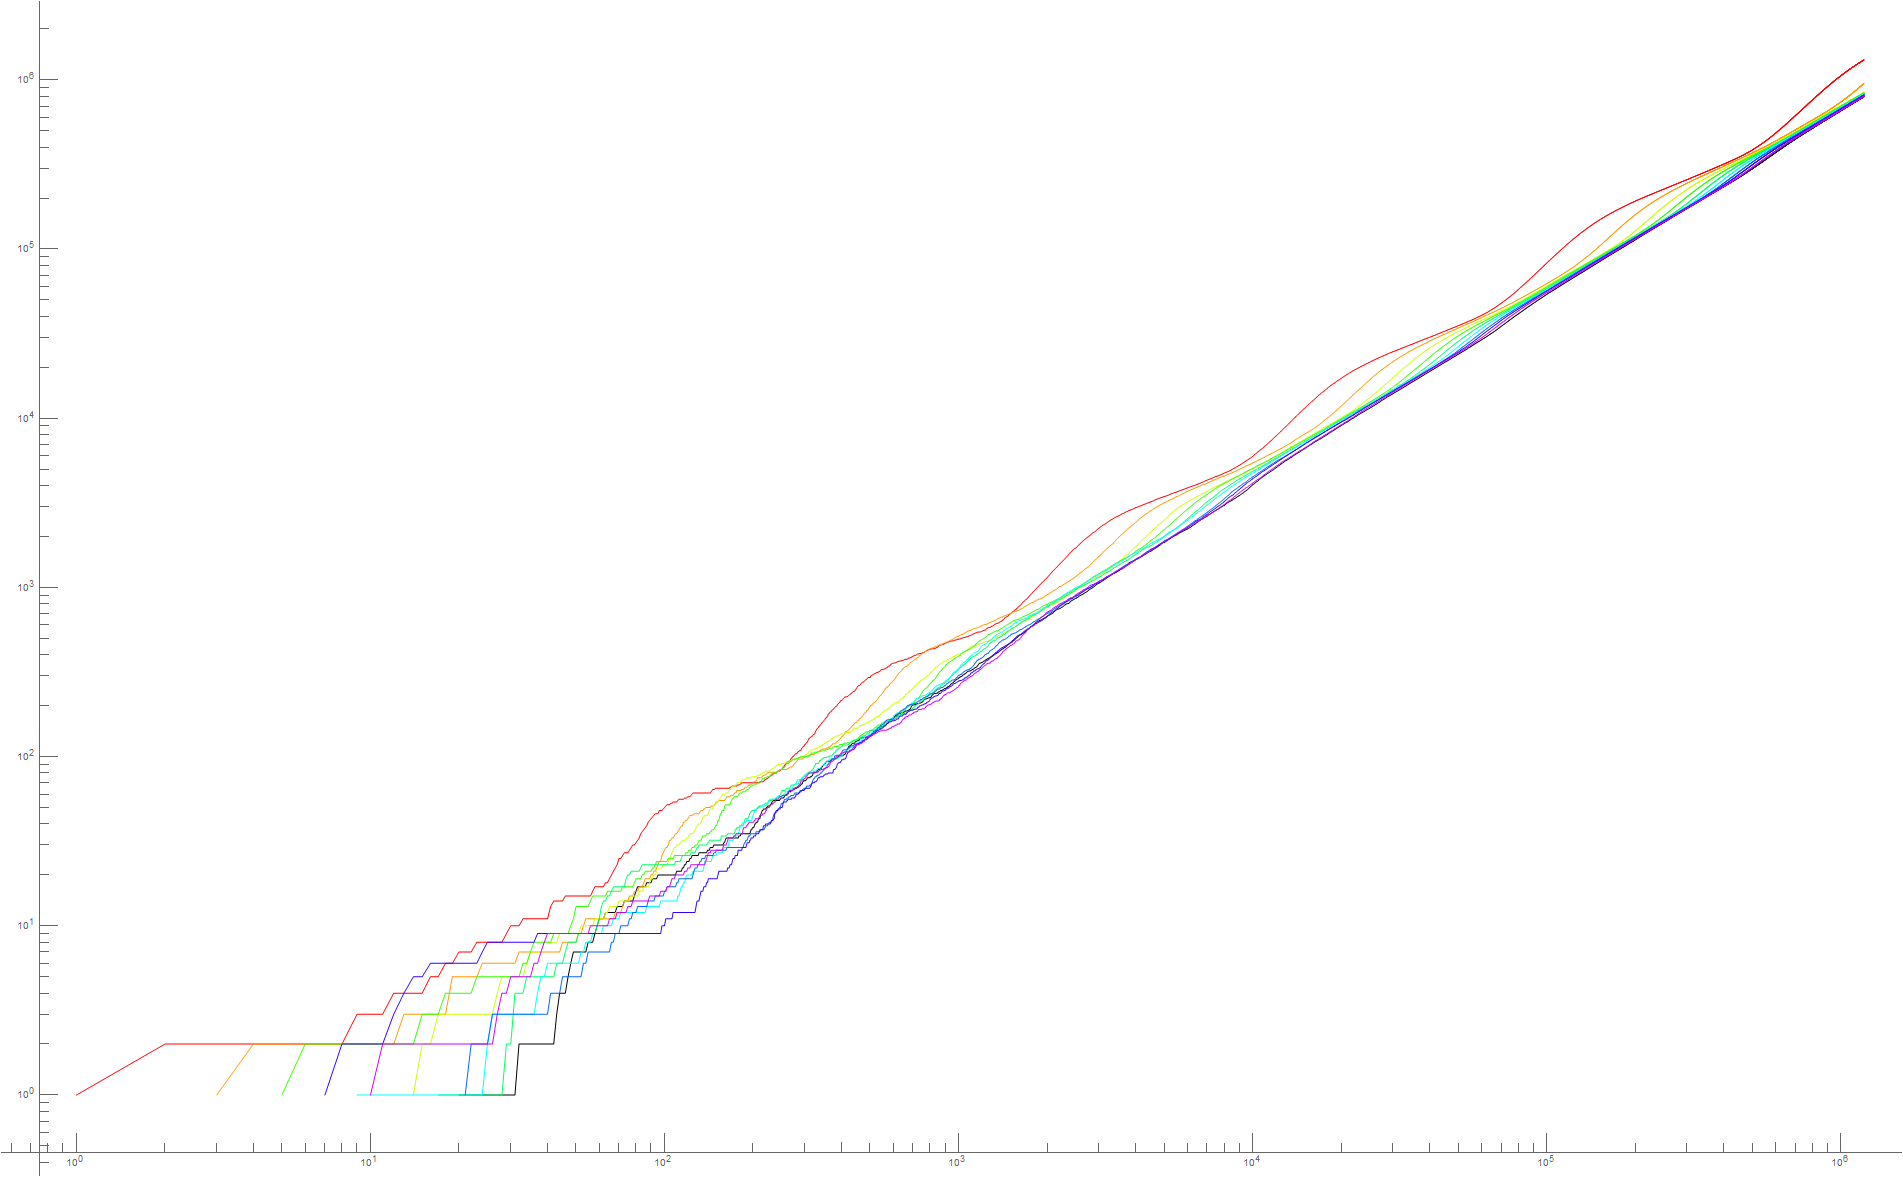
Figure 3.2 is a plot of t(d, n) for 1 ≤ n ≤ 10000, with the same color function indicating d. The expanded log-log plot shows a quasi-cyclical relationship among t(d, n) that reflects Benford’s Law. (See Code 3.2.)
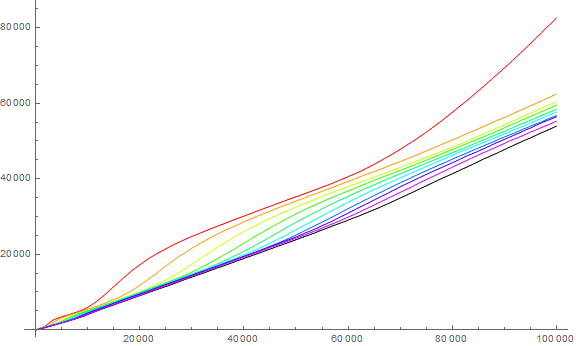
Figure 3.3 is an animation that applies the color function in the above plots to indicate terms in a(n) for 1 ≤ n ≤ 1000 where d appears in a(n). This plot aims to show one of the influences on a(n), i.e., the digits d that tap t(d, n) as part of the sum a(n + 1).
There are vertical bands of denser occasions of d as expected, aligning with the y-axis.
Frequency of m in a(n).
The sequence a(n) begins with many repeated terms. How frequently are terms repeated in a(n)?
We may write a sequence b(i) that simply assigns the number of appearances of a value a(i) in the sequence a(n). We see two 1s at the start of the sequence. There appear to be only two 1s in the sequence overall (given 1200000 terms). Thus, b(1) = 2 as does b(2). In the studied range a(n) for 1 ≤ n ≤ 1200000, the maximum number of appearances of the same term is 4. Extending the range to a(n) for 1 ≤ n ≤ 4194304, the maximum of 4 still holds (though there may be many more appearances of the same number if we extend data further).
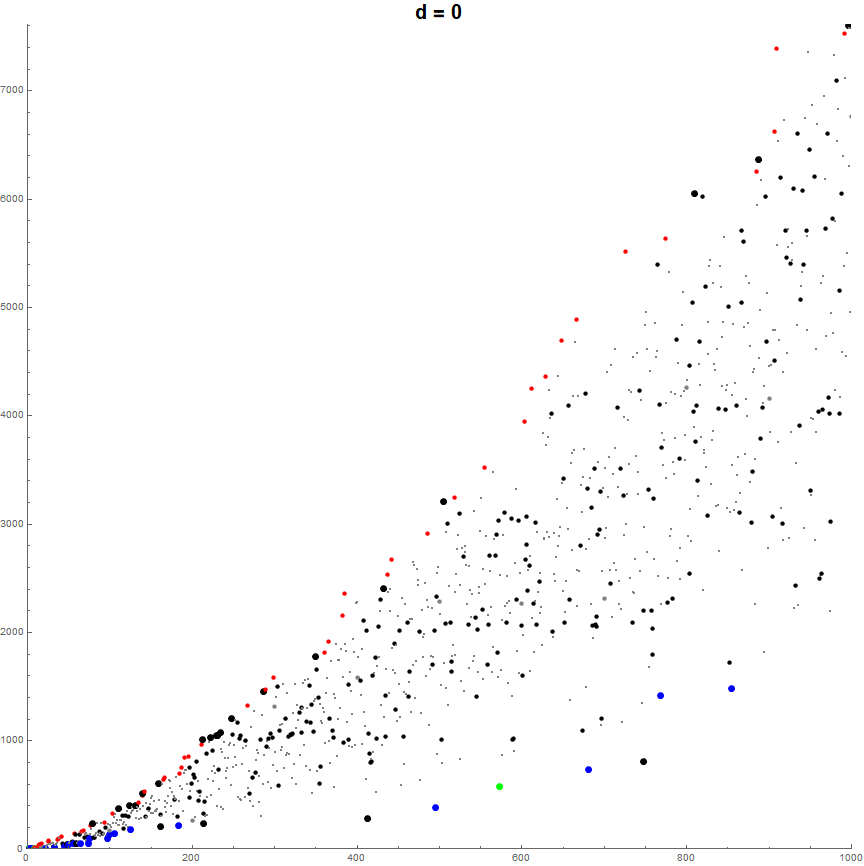
Figure 4.1 is a plot of a(n) for 1 ≤ n ≤ 240 showing the degree of repetition of the value m. Singletons appear in tiny gray dots, while duplicate terms are both shown in small blue, triplicated terms in medium green, and quadruplicated terms in large orange-red dots.
The orange-red terms shown are (n, a(n)) = (43, 50), (47, 50), (59, 50), (60, 50).
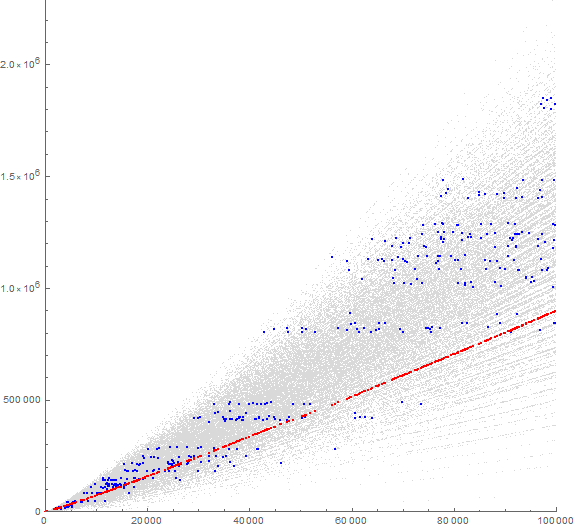
We note that we might certify the number of repeated terms for the range 1 ≤ a(n) ≤ 1312307, finding the maximum a(R(240)) = a(61714) = 1312307 that is less than f(1200000) = 1314253.
Figure 4.2 is a plot of a(n) for 1 ≤ n ≤ 400000 and a(n) ≤ 1312307 showing all terms in color that appear more than once, the rest in tiny gray. The full dataset appears in this plot, though we cannot ascertain without more data whether we have complete sets of repeated terms for a(n) > 1312307.
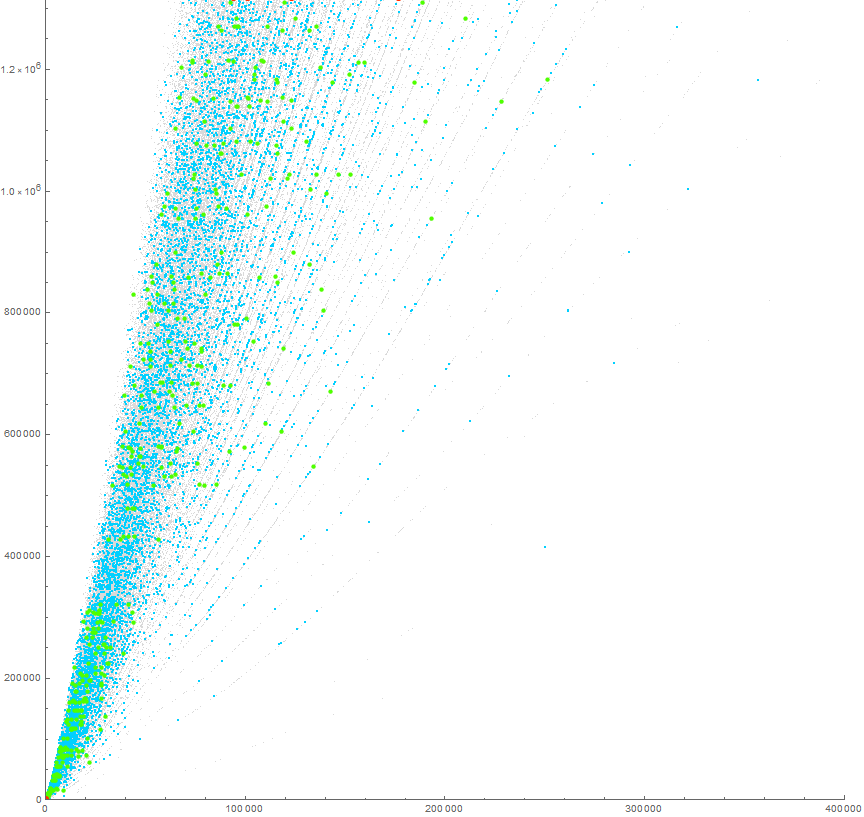
At the top of the plot we see cut off a row of orange-red points at n in {94124, 101302, 123070, 176666} where a(n) = 1318521, yet we cannot be certain there may not be a fifth or sixth, etc. term a(n) = 1318521.
These plots, showing a(n) with less vertical compression, demonstrates that the apparently linear striations are in fact curves.
Table 4.1: Addendum: given the extended dataset of 4194304 terms, with f(4194304) = 3642986, we certify the following terms that have exactly 4 appearances in a(n):
m n_1 n_2 n_3 n_4
-------------------------------------------------
50: 43 47 59 60
1318521: 94124 101302 123070 176666
5623747: 334130 363395 382768 437809
14533401: 653125 695228 768616 925002
17789106: 949452 1031037 1294527 1329006
28722780: 1378749 1820558 1821201 2008379
28722780: 2048836 2127003 2228150 2272850
28722780: 2275397 2356821 2386809 2563661
53856520: 2634640 2725569 2820172 2836299
54197906: 2894457 3066466 3113803 3134234
...
Investigation of striations.
The examination of local minima yielded some terms in S that we suspect may not (all) represent true local minima. These are S(i) for i > 60, the largest index of a local minimum that we can certify using f(n). Here we continue the data in Table 1 to examine the nature of the terms that comprise a striation of the “paint-sprayer” effect seen in the scalar plot.
Table 5.1 shows the difference M = a(S(i)) − f(S(i) − 1) for minima a(S(i)) and i > 60, with D = digital sum of a(S(i) − 1). We derive “sum of same digits arising in all prior terms” via a(S(i)) − D.
i S(i) a(S(i)) a(S(i)-1) D a(S(i))-D f(S(i)-1) M
---------------------------------------------------------------------
61 846254 2056410 11200202 8 2056402 829708 1226694
62 850706 2069791 21221222 14 2069777 836471 1233306
63 862832 2106379 12121010 8 2106371 854983 1251388
64 874889 2143171 12110012 8 2143163 873333 1269830
65 880620 2160645 11210020 7 2160638 882054 1278584
66 883853 2170608 10120202 8 2170600 887010 1283590
67 891025 2192381 10102211 8 2192373 897875 1294498
68 891253 2193061 11202200 8 2193053 898245 1294808
69 896732 2209715 22121021 11 2209704 906656 1303048
70 900507 2221388 12122201 11 2221377 912297 1309080
71 904066 2232351 12111002 8 2232343 917659 1314684
72 909622 2249540 20120220 9 2249531 925981 1323550
73 909632 2249580 20011222 10 2249570 925996 1323574
74 910106 2251054 10120020 6 2251048 926708 1324340
75 911115 2254190 11020010 5 2254185 928221 1325964
76 927217 2304309 11120122 10 2304299 951901 1352398
77 941266 2348504 22121201 11 2348493 972933 1375560
78 943943 2357103 20121211 10 2357093 976849 1380244
79 946668 2365741 10110120 6 2365735 980789 1384946
80 953558 2387499 22212022 13 2387486 990794 1396692
81 956259 2396104 12221210 11 2396093 994717 1401376
82 963553 2419398 21210120 9 2419389 1005477 1413912
83 965049 2424266 10202101 7 2424259 1007699 1416560
84 970102 2440529 20202012 9 2440520 1014900 1425620
85 975165 2456859 20222211 12 2456847 1022341 1434506
86 978130 2466485 22012101 9 2466476 1026670 1439806
87 982462 2480527 21012222 12 2480515 1032923 1447592
88 983048 2482379 11211021 9 2482370 1033774 1448596
89 987780 2497871 11220220 10 2497861 1040629 1457232
90 993293 2515613 10000201 4 2515609 1048561 1467048
91 994959 2520934 20021221 10 2520924 1050912 1470012
92 1000208 2537903 20121002 8 2537895 1058251 1479644
93 1000585 2539134 21020200 7 2539127 1058791 1480336
94 1025922 2622210 20202100 7 2622203 1094233 1527970
95 1025974 2622419 11202000 6 2622413 1094315 1528098
96 1027615 2627915 11221212 12 2627903 1096611 1531292
97 1031579 2641328 22121122 13 2641315 1102123 1539192
98 1031676 2641650 21021201 9 2641641 1102251 1539390
99 1032111 2643096 20121002 8 2643088 1102816 1540272
100 1034793 2651968 11112200 8 2651960 1106536 1545424
101 1037879 2662149 20010121 7 2662142 1110688 1551454
102 1041189 2673130 22100102 8 2673122 1115174 1557948
103 1042287 2676741 21001001 5 2676736 1116622 1560114
104 1042378 2677053 20100122 8 2677045 1116765 1560280
105 1044840 2685169 20200210 7 2685162 1120148 1565014
106 1046076 2689315 10020010 4 2689311 1121891 1567420
The digit signature δ.
We note that these terms a(n) have preceding terms m = a(n − 1) whose distinct digits d in {1, 2} with any number of zeros. Therefore we expect that the striations are perhaps constellations of numbers that have a given set of distinct digits, each with any number of zeros, as d = 0 does not affect the sum upon which a(n) is based. We would then expect the striations to correspond to distinct digit signatures in a(n − 1), with the smallest digits populating the lower region of the plot, and the largest digits the higher region of the plot. This entails that there shall be a pandigital digit signature (ignoring 0, since 0 is the additive identity) and that the number of striations are finite at 29 − 1 = 511. We subtract 1, since there can be no null digit signature—all nonzero m have some distinct digits of consequence, and 0 is not in the sequence. This would explain the apparent branching observed, and that the plot then would perhaps form a sort of tree.
In order to investigate this, we generate a sequence b(n) = number formed by the union of digits of a(n − 1), discarding 0. Therefore, b(n) functions as a “serial number” or digit signature δ to which, if the above conjecture proves correct, identifies numbers that form a striation. In order to compactify the 511 possible configurations of sorted distinct digits, we might instead write k, the sum of 2(d − 1) for each distinct digit d in a(n − 1), so as to obtain a binary number we convert to decimal. Thus, a number like 440109 has the distinct digits δ = {1, 4, 9} (ignoring 0), and thus we have the compactified signature k = 2(1 − 1) + 2(4 − 1) + 2(9 − 1) = 20 + 23 + 28 = 1 + 8 + 256 = 265. We find numbers that have this signature in a striation shown at this link. (See Code 6.2 to plot a given striation using a set of distinct digits, i.e., a digit signature.)
Therefore, the digit signature of the previous term a(n − 1) governs the striations observed in a(n).
Figure 6.1 is a plot of a(n) for 1 ≤ n ≤ 10000 with the color function relating to k = sum of 2(d − 1) for each distinct digit d in a(n − 1), divided by 512. See an extended plot for 1 ≤ n ≤ 100000. (See Code 6.1)
We can thus pick out individual striations in the “paint sprayer” plot by searching b(n) for indices n such that b(n) = k.
Figure 6.2 shows a(n) such that the previous term contains {1} and another nonzero digit d ≠ 1. Here the bottom-most striation corresponds if extended far to the right, to the points that are included in S(i) for i > 60. The color function relates to the value of d, (or rather that same ratio k/512 as previously defined). The topmost accentuated striation relates to numbers whose previous terms contain {1, 9} (and usually also 0).
In the study of these striations, we soon find that j, the number of digits codified by k, i.e., the number of nonzero distinct digits, governs the height of the strand family, whereas the strand family is plotted higher according to the values of d in the digit signature. This induces us to consider, perhaps, that the sums of these digit signatures are the ultimate arbiter of their trajectories. However, it seems this is not the complete reason, and it remains to be investigated what governs the trajectory of the strands, which have been shown to be upward curves in actuality. Are these curves hyperbolic? The curves may also waiver but this also might be an optical illusion.
In thinking about the fact that striations pertain to a certain digit signature δ (compactified by k) and recalling the partial sums t(d, n) relating to the total number of digits d in the sequence a(n) at index n, it is clear that the numbers of a given signature δ must form a striation in the graph. The striation δ has points whose progenitor a(n − 1) has nonzero digits in δ and whose digit sum is D, thus we have D + Σ_{d ∈ δ} t(d, n). Figure 3.1 shows that the sequences t(d, n) undulate roughly according to Benford’s Law, therefore the curve is perhaps not purely geometric; the “furriness” or small-scale deviation from Σ_{d ∈ δ} t(d, n), which itself might be a more finely-resolved curve, is attributable to the varying digit sum D, since the progenitor numbers a(n − 1) do not have the same number of d in δ. Hence, the finer resolution that gives rise to the apparent “negative space” evident around n = 175000 or n = 220000 may have to do with occasions across multiple striations where there tend to arise progenitor numbers a(n − 1) whose digit sums are more tightly similar.
Figure 6.3 is a plot of a(n) for 1 ≤ n ≤ 105, showing the progenitor numbers in blue that have the distinct digits δ = {1, 2, 4, 8}, which we may write as compactified signature k = 138. These have next terms a(n+1) that form the striation 138 shown in red.
Because of the fact that Σ_{d ∈ δ} t(d, n) is the dominant addend for terms in striation δ, we might instead plot these addends rather than a(n). Thus we produce a sequence h(n) = a(n) − D. The plot of h(n) is rather similar to that of a(n) especially at large scales, because Σ_{d ∈ δ} t(d, n) grows faster than D as n increases so as to render the latter infinitesimal compared to the former.
Figure 6.4 is a plot of the first 240 terms of h(n), showing a(n) in small blue dots, and h(n) in red.
Therefore, the “straightening” effect of h(n) is ever smaller as n increases.
The probable nature of the plot of a(n) for very large n.
We do know that the higher sums of digit signatures with j elements will gradually appear above the striations present in the study range (n < 1200000), until we have pandigital numbers. It is only then that the complete range of the “paint sprayer” might be seen. This entails that the full extent of the “spray” may only be seen after we have nearly a billion terms.
Likewise, we see that k for j = 1 become sparser as n increases decimal rank interval in a(n). It seems evident that the density of the plot sloops upward, having to do with the commonness of digit signatures for numbers m in a(n) of an ever-increasing length. Therefore, the digit signatures associated with smaller j may grow increasingly rarified as we approach the pandigital a(n), perhaps rendering the plot for very large n somewhat like a lunette, merely on account of the sparsity of points corresponding to low j.
(Note: on 19 December 2020 the smallest pandigital number was found. Notes on this appear after the senary investigation.)
The senary version of a(n).
We now turn to a version of a(n) for base b = 6, thus, a(6, n), so as to explore the appearance of a plot that shows all possible “paint sprayer” striations given the materialization of pandigital m in a(6, n − 1). The study simplifies the algorithm behind a(n), since there are only 5 nonzero senary digits d, thus, only 25 − 1 = 31 striations, and the dataset required to attain pandigital terms in a(6, n) is much smaller. Also expected is a rarification of the striations relating to the digit signatures with small j, where, of course, the maximum (pandigital) j = 5. Since there are much fewer striations, we might get some traction on the reasons why a particular striation appears where it does.
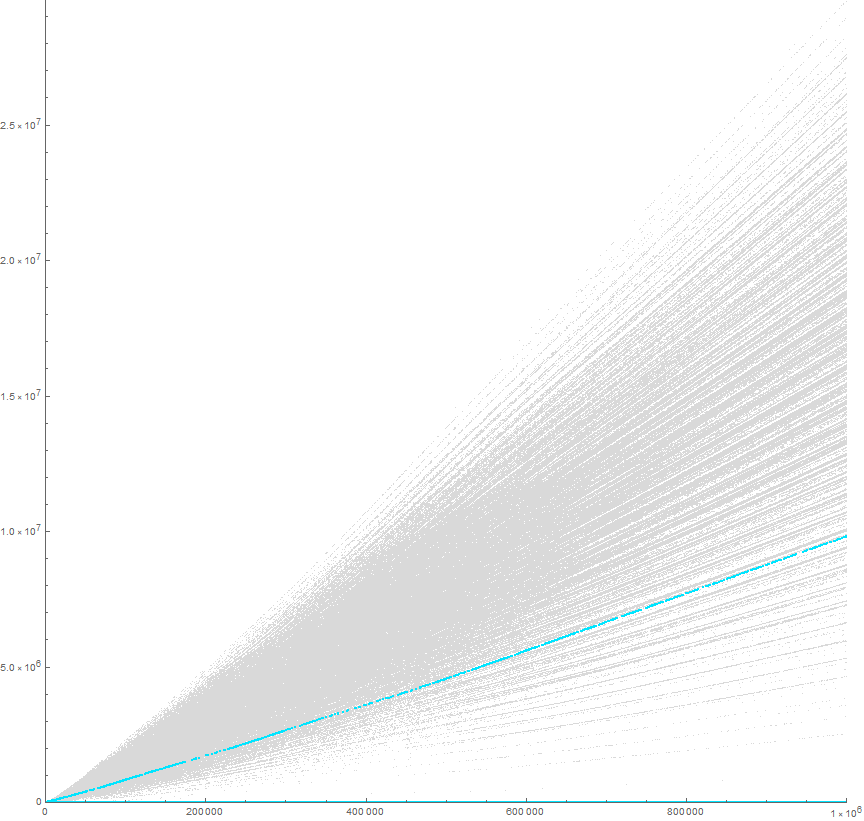
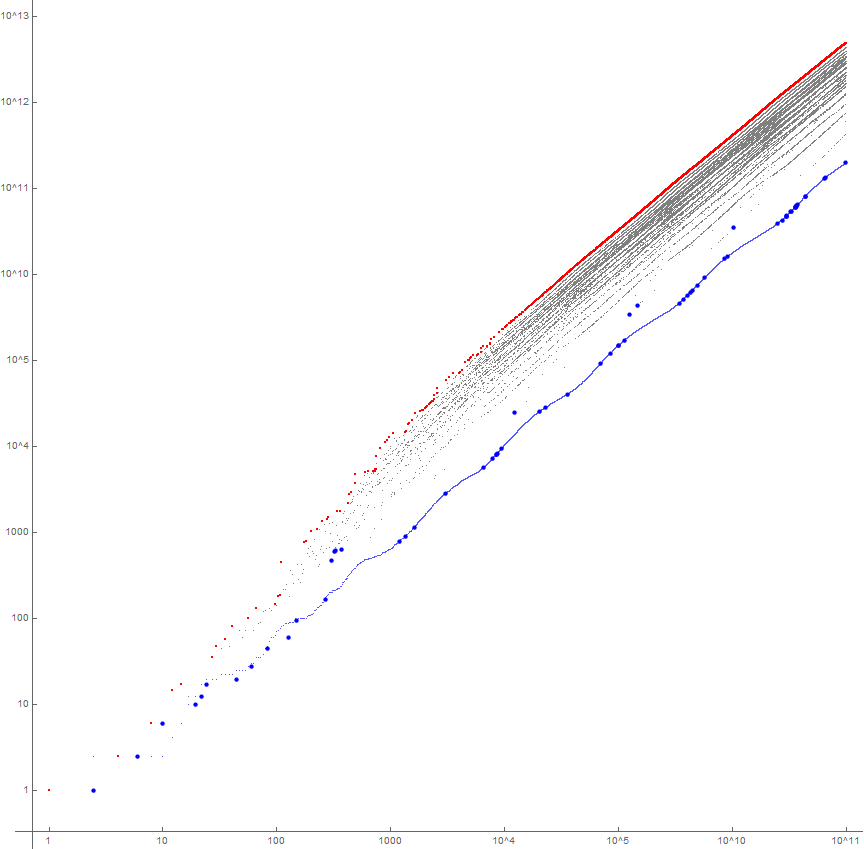
Figure 7.1 is a plot akin to Figure 1.1, where the ticks relate instead to senary figures, thus, “10000” is instead 64 = 1296 decimal. The maxima appear in red and the local minima in blue. The blue line relates to the t(6, 1, n), that is, the partial sums of the senary digit 1 in sequence a(6, n), which for the most part serves as the lower bound for the sequence a(6, n).
The plot demonstrates fewer striations and the same “paint sprayer” fanning effect, curving upward as in the case of decimal a(n) shown by Figure 1.1.
The smallest case of a pandigital term (ignoring 0) is a(6, 450) = 2050, which is “13254” in senary notation.
(450, 2050) gives rise to (451, 4327), in senary, (2030, 13254) → (2031, 32011), the first term of the striation associated with δ = {1, 2, 3, 4, 5}. Remember that the striations are designated according to the digits of their preceding terms.
We see the pandigital striation δ = {1, 2, 3, 4, 5} (k = 31) running along the top, the highest red records in Figure 7.1, more evident in Figure 7.2 below. Since we cannot have a striation corresponding to j > 5, no further striations exist, and none can appear higher than the pandigital striation, since δ = {1, 2, 3, 4, 5} represents the summation of all the registers available in base 6.
Figure 7.2 is a plot of a(6, n) for 1 ≤ n ≤ 67, akin to Figure 1.2 (which shows the decimal case a(n)):
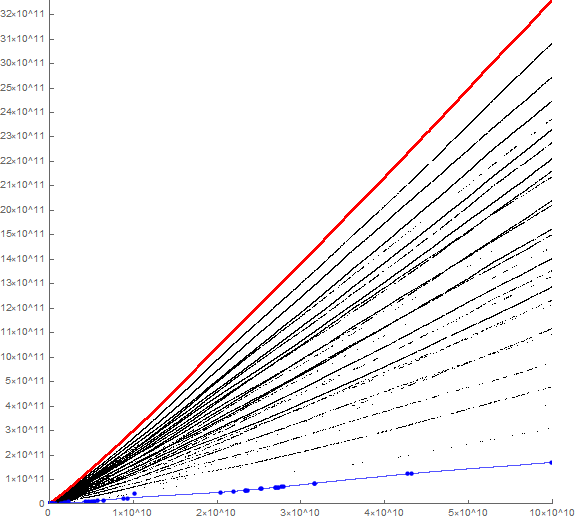
Figure 7.3 is a plot of t(6, d, n) for 1 ≤ n ≤ 67 akin to Figures 3.1-2, using a color function indicating d, where black pertains to d = 0, and red through blue to the senary digits 1 through 5 inclusive. We see the same reflection of Benford’s Law here as well. Click to see a log-log plot that perhaps better demonstrates the undulation of the various partial sums of the number of senary nonzero digits.
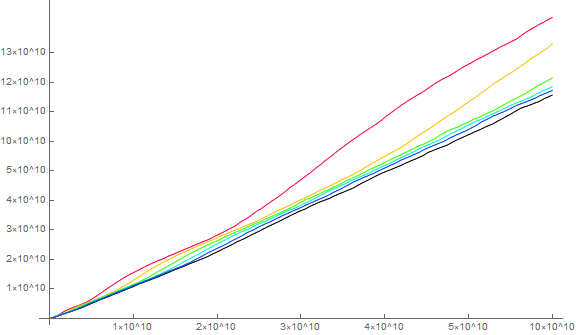
Figure 7.4 is a complete animation of a plot showing all the striations possible in a(6, n). The digits shown pertain to the term that precedes the data plotted in the striation:
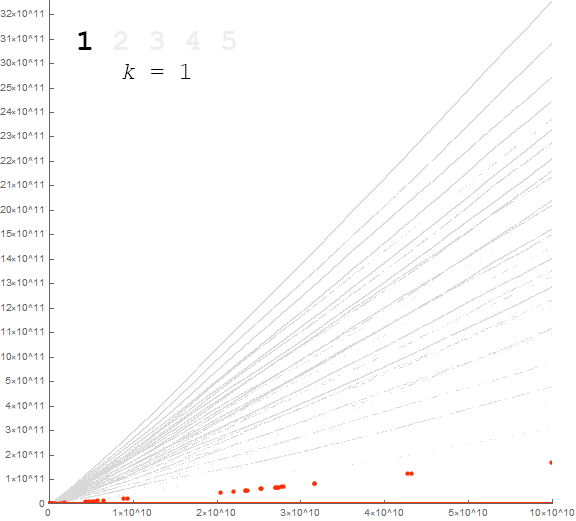
Figure 7.5 is a log-log plot of a(6, n) that demonstrates the maturation of the sequence into its 31 striations. Records appear in red, eventually appearing solidly of the digit signature {1, 2, 3, 4, 5} around n = 64. Local minima appear in large blue dots. The wavy blue line is t(6, 1, n), i.e., the partial sums of the number of appearances of digit 1 in a(6, n), which, for n > 38, serves as the lower bound for the sequence. Note that t(6, 1, n) appears in red at the top of the plot at Figure 7.3:
The senary version, a(6, n), beautifully demonstrates many of the thoughts we had about what a post-pandigital plot of a(n) might resemble, of course in miniature, with fewer striations. (We can compare this to the decimal version.)
We see that the number of striations is finite, governed by all the possible non-null combinations of the senary digits where each digit is distinct, thus we see 25 − 1 = 31 striations, with those that have a low j proving more rarified as n increases. We see that the pandigital signature δ = {1, 2, 3, 4, 5} in a(6, n − 1) sets records in the following term and proves to be the most solid striation. The plot doesn’t have the appearance of a lunette; it retains its “paint sprayer” appearance, with the topmost striations the strongest, and certain of the lower striations “intermittent”, generally arranged according to the function Σ_{d ∈ δ} c(6, d, n).
The least m of a given digit signature in a(b, n).
Since we know that the number of striations is finite, i.e., N = 2(b − 1) − 1 for a(b, n), where b is the number base under consideration, we can identify the first occasion of a given base-b digit signature δb in a(b, n − 1).
In senary, i.e., a(6, n), this regards N = 25 − 1 = 31 terms. Again, we consider the 31 possible (nonzero) digit signatures δ6, i.e., {1}, {2}, …, {5}, {1,2}, {1,3}, …, {4,5}, etc., {1,2,3,4,5}, this last-mentioned signature the “pandigital” for purposes of this sequence. We employ compactification using:
k = Σ(d ∈ δ) 2(d − 1).
Table 9.1 shows the least index n and a(6, n) for the 31 digit signatures δ6, in order of the compactification of the digit signature, k:
a(6,n)
k δ_6 n (senary) (decimal)
-----------------------------------
1 1 1 1 1
2 2 3 2 2
3 12 7 12 8
4 3 166 3303 759
5 13 8 13 9
6 23 14 32 20
7 123 44 132 56
8 4 5 4 4
9 14 19 14 10
10 24 13 24 16
11 124 81 1204 292
12 34 60 334 130
13 134 38 134 58
14 234 55 243 99
15 1234 288 13234 2038
16 5 18 50 30
17 15 29 105 41
18 25 27 52 32
19 125 77 125 53
20 35 16 35 23
21 135 58 351 139
22 235 69 253 105
23 1235 123 1325 341
24 45 49 54 34
25 145 79 415 155
26 245 56 452 176
27 1245 227 11452 1688
28 345 184 5435 1247
29 1345 172 3415 803
30 2345 124 2435 599
31 12345 450 13254 2050
Again, remember that these terms themselves are not part of their eponymous striations, but merely instigate them. This is demonstrated in Figure 6.3, where the blue terms are progenitors a(n) and the red are the resultant terms a(n+1) that form the striation k = 138 → digit signature δ = {1, 2, 4, 8}. Therefore, in the example borne out by Figure 6.3, we see the terms that have the distinct digits 1, 2, 4, and 8 (and possibly some 0s) in blue, and the following terms form the red striation.
Figure 9.1 is a plot of the points a(6, n+1) instigated by a(6, n) above, labeled with k.
In mid December 2020, we obtained 222 = 4194304 terms of a(n) (that is, the original decimal version), which proved sufficient to reveal all 511 digit signatures, including the pandigital case.
The smallest pandigital decimal appears at a(3994834) = 127643598. We see that the following term 137801427 sets a record and is the first term in the striation k = 511. For n ≤ 222, we see no further pandigital terms, but expect them to become common as n increases.
Due to the length of the table of least indices n that have the digit signature δ, we link a text file formatted similarly to Table 8.1.
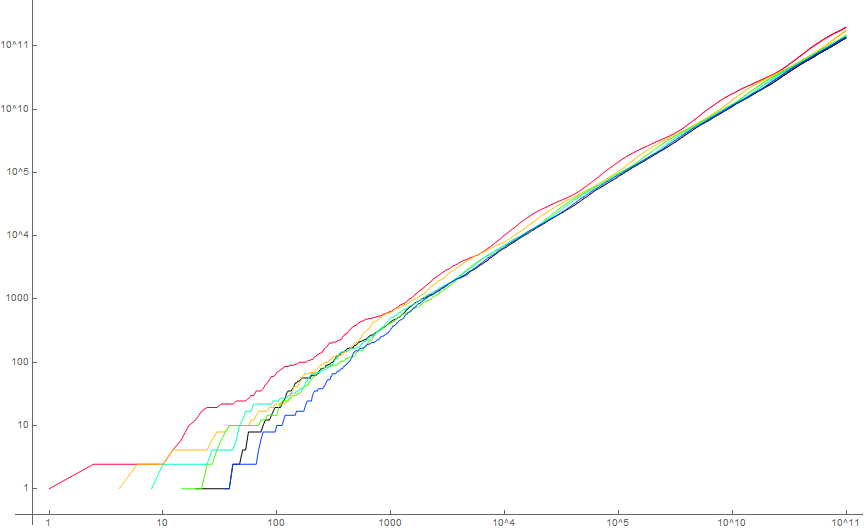
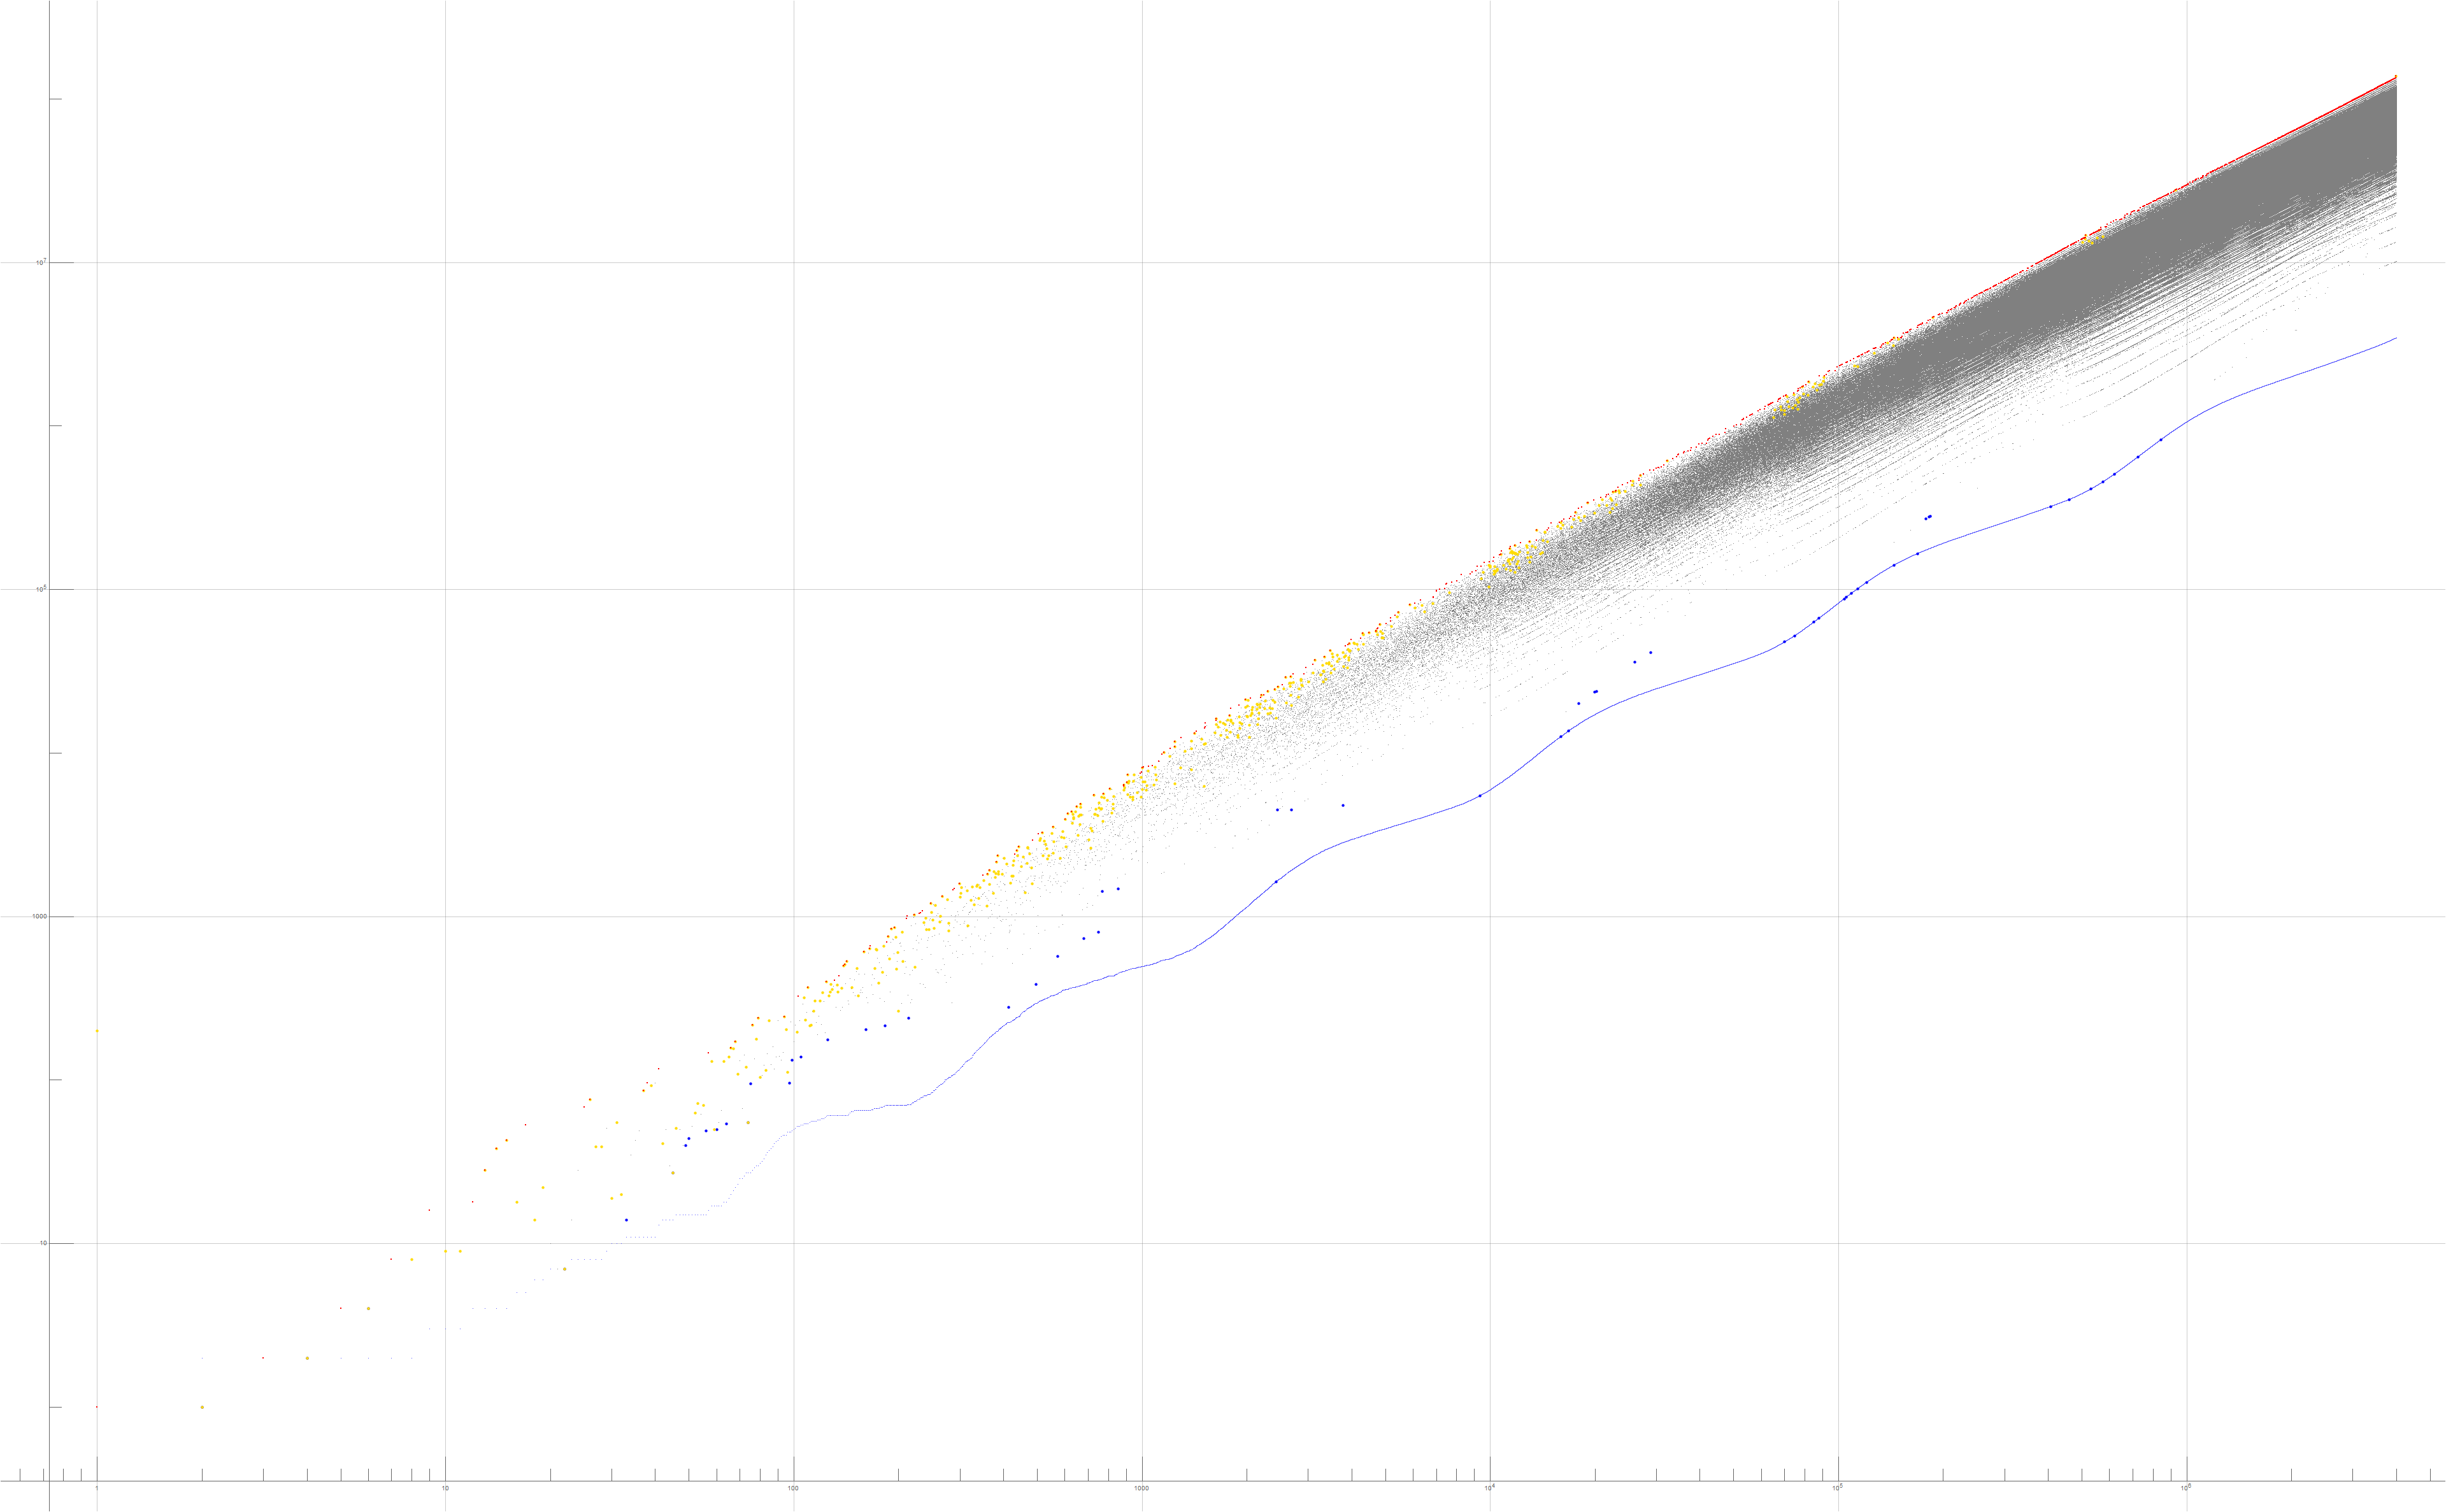
Finally, we present a high resolution log-log plot of a(n) for 1 ≤ n ≤ 4 × 10⁶ marking in red the locations of the first terms of the 511 striations of a(n) available at this link. This plot resembles Figure 7.5 in overall nature. This second plot is produced more akin to Figure 7.5, but showing the first terms in gold.
We turn to the nature of maxima in a(n), whose indices are in R, having examined local minima in an earlier session.
Table 9.2 shows lineages k represented among the first dozen records in A279818. Click here to see an extended table for all the records in the extended dataset. The column R(i) is the index of the i-th record in a(n). a(R(i) − 1) is the progenitor of the record a(R(i)). The number k is the binary compactification of the distinct nonzero digits d in a(R(i) − 1), and D lists the distinct digits, with a period “.” serving as a placeholder so as to maintain the d in columns.
i R(i) a(R(i)-1) a(R(i)) k D
--------------------------------------------------------
1 1 - 1 0 .........
2 3 1 2 1 1........
3 5 2 4 2 .2.......
4 7 4 8 8 ...4.....
5 9 8 16 128 .......8.
6 12 9 18 256 ........9
7 13 18 28 129 1......8.
8 14 28 38 130 .2.....8.
9 15 38 43 132 ..3....8.
10 17 18 53 129 1......8.
11 25 28 68 130 .2.....8.
12 26 68 76 160 .....6.8.
...
Table 9.3 lists the indices of the first records whose progenitors have the j largest decimal digits d:
j i R(i) a(R(i)) a(R(i)-1) D k
------------------------------------------------------------
1 6 12 18 9 ........9 256
2 28 140 509 498 .......89 384
3 39 222 1025 987 ......789 448
4 83 1243 11741 6789 .....6789 480
5 130 5887 80475 68759 ....56789 496
6 201 32271 614375 458679 ...456789 504
7 335 186544 4600556 3674958 ..3456789 508
8 628 927955 27775329 24786935 .23456789 510
9 1885 3994835 137801427 127643598 123456789 511
From these first appearances of patterns D that contain a solid block of the largest decimal digits, we note that there are still other records involving different patterns D. The pattern D = {2,3,4,5,6,7,8,9} (i.e., k = 510) sets all the records between 1143918 ≤ n < 3994835. We observe the tendency is for patterns shown in Table 9.3 to dominate the records.
At some point for n greater than a certain, hitherto unreached threshold, the records will be dominated by numbers a(n) instigated by m with the “pandigital” digit signature k = 511. It seems we have already seen such a threshold for a(6, n).
Remaining questions.
What is the reason for apparent “negative space” that materializes as a simultaneous narrowing of the striations across many in the vicinity of, say, n = 175000 or 220000? Does this mean that n has an impact (aside from the obvious cumulative effect) on a(n)? Our current conjecture suggests that these “negative spaces” are merely places where multiple striations cross. This is engendered by the various digit counting functions shown by Figure 3.2, especially the enlarged plot.
Is there a ceiling to the number of times a value m might appear in a(n)? Is this ceiling 4?
Conclusion.
The “paint sprayer” sequence starts with a simple premise involving the digit sum of the previous term plus the sum of same digits arising in all prior terms. The sequence includes many repeated terms and is not a permutation of the natural numbers. We showed that the local minima can be guaranteed when they are (generally, for n ≥ 96) equal to the number of 1s seen in the sequence at (n − 1). By these minima, we can also confirm the number of repetitions of terms to a certain point. The inspection of the minima and the frequency of the occurrence of nonzero digits d, particularly the partial sums of the latter, lead us to consider that the digit signatures of a(n − 1) explain the striations, but perhaps not fully their curve nor their exact appearance or order from the x-axis. Since we are dealing with 9 nonzero decimal digits, we anticipate 29 − 1 = 511 total striations, building over and amid the upper regions of the plot as n increases. The apparent branching thought to be seen is actually the crossing of certain striations δ with differing values of j; the plot is not dendritic. The shape of the striations relates to the more significant addend Σ_{d ∈ δ} t(d, n) and is probably not geometric (i.e., a hyperbola or parabola), though the plot taken as a whole appears to be turning upward especially in the first values.
The examination of a senary version of the sequence shows that indeed, we can expect the saturation of all the expected striations, and that those striations δ for which j is minimal prove rarified as n increases. The senary version shares all the major characteristics of the decimal version.
We have identified the progenitors of the 511 striations in the plot of A279818, requiring nearly 4000000 terms to exhibit maturation. The least “pandigital” term is A279818(3994834) = 127643598, touching off the 511th striation in the “paint sprayer” sequence.
There remain some unanswered questions regarding this sequence, but most of the behavior of a(n) in its plot is easily explained.
Appendix:
For those who want to compute their own terms and produce work or extend the research: this work was conducted on a laptop purchased mid December 2019 with the following specifications: Intel Xeon E-2286M CPU @ 2.40 GHz, 32.0 Gb memory, 64-bit Windows 10 OS, Nvidia Quadro RTX 4000 graphics card, using Wolfram Mathematica 12.1. The following code was used in generating the data, however we have reduced the scope of the plots and datasets so as to generate results in a few moments. The original dataset used contained 1200000 terms, while the senary dataset contained 524288 terms. Also be advised that a dataset that large may not plot so as to reveal the appearance of the data, let alone foster experimentation given 2020 machinery off the shelf. Hence the reason why we shifted to a senary model in lieu of pressing for a decimal pandigital-friendly dataset.
The identification of the pandigital decimal term required two overnight runs 17-19 December 2020, using a code that can resume calculations after interruption, garnering 222 = 4194304 terms. The table of n, a(n) in OEIS b-file format is 70.2 megabytes. The dataset can be plotted.
Code 1.1: Generate a(n) and store it in variable a:
a = Monitor[Block[{a = {1}, r = Range[9], s}, Array[Set[s[#], 0] &, 9];
Do[(AppendTo[a,
Total@ Map[# s[#] &, Position[#, _?(# > 0 &)][[All, 1]] ] +
Total[r #]]; MapIndexed[AddTo[s[First[#2]], #1] &, #]) &@
Most@ DigitCount@ Last@ a, {i, 2^16}]; a ], i] ;
Code 1.2: Generate maxima and local minima, storing these in variable rr and ss, respectively. Note that ss is not validated automatically.
rr = Block[{r, s}, r = Union@ FoldList[Max, a];
s = Array[FirstPosition[a, r[[#]] ][[1]] &, Length@ r]];
ss = Block[{r, s, t = Reverse@ a, len = Length@ a},
r = -Reverse@ Union@ FoldList[Max, -t];
s = 1 + TakeWhile[
len - Array[FirstPosition[t, r[[#]] ][[1]] &, Length@ r], # <=
Length@ a &]];
Code 1.3: Plot Figure 1.1.
ListPlot[Array[
Style[Labeled[#2, StringJoin @@ {ToString[#1], ".", ToString[#2]}], Which[
MemberQ[{1, 8, 573}, #], Green,
MemberQ[rr, #], Red,
MemberQ[ss, #], Blue,
True, Gray],
PointSize@ Which[
MemberQ[rr, #], Large,
MemberQ[ss, #], Large,
MemberQ[{1, 8, 573}, #], Large,
True, Small]] & @@
{#, a[[#]]} &, 120],
ImageSize -> Large, AspectRatio -> 1, PlotStyle -> PointSize[Tiny]]
Code 1.4: Plot Figure 1.2.
Block[{r, s, nn = Length@ a, mm},
mm = 10^(Log10[nn] - 1);
r = ReplacePart[ConstantArray[-mm, nn],
Map[# -> a[[#]] &, TakeWhile[rr, # <= nn &]]];
s = ReplacePart[ConstantArray[-mm, nn],
Map[# -> a[[#]] &, TakeWhile[ss, # <= nn &]]];
ListPlot[{a[[1 ;; nn]], r[[1 ;; nn]], s[[1 ;; nn]]},
ImageSize -> 864, AspectRatio -> 1,
PlotRange -> {{0, nn}, {0, Max@ a[[1 ;; nn]]}},
PlotStyle -> {
Directive[Black, PointSize[Tiny]],
Directive[Red, PointSize[Small]],
Directive[Blue, PointSize[Small]]} ] ]
Code 3.1: Generate the digit tallies c(d, n) and corresponding partial sums t(d, n), here storing these in s# and aa# respectively.
s1 = Map[DigitCount[#, 10, 1] &, a]; aa1 = Accumulate@ s1;
s2 = Map[DigitCount[#, 10, 2] &, a]; aa2 = Accumulate@ s2;
s3 = Map[DigitCount[#, 10, 3] &, a]; aa3 = Accumulate@ s3;
s4 = Map[DigitCount[#, 10, 4] &, a]; aa4 = Accumulate@ s4;
s5 = Map[DigitCount[#, 10, 5] &, a]; aa5 = Accumulate@ s5;
s6 = Map[DigitCount[#, 10, 6] &, a]; aa6 = Accumulate@ s6;
s7 = Map[DigitCount[#, 10, 7] &, a]; aa7 = Accumulate@ s7;
s8 = Map[DigitCount[#, 10, 8] &, a]; aa8 = Accumulate@ s8;
s9 = Map[DigitCount[#, 10, 9] &, a]; aa9 = Accumulate@ s9;
s0 = Map[DigitCount[#, 10, 0] &, a]; aa0 = Accumulate@ s0;
Code 3.2: Generate a plot of t(d, n) for 1 ≤ n ≤ 10000 using a color function that draws d = 0 in black, d = 1 in red, and d = 9 in purple, with the other digits d spaced spectrally equidistant (RGB spectrum) between d = 1 and d = 9. Eliminate the directive “ScalingFunctions -> {"Log10", "Log10"},” if a scalar plot is desired.
ListPlot[Transpose@
Table[Array[
ToExpression@ StringJoin["aa", ToString[#], "[[", ToString[i], "]]"] &, 10, 0],
{i, Length@ aa0}],
Joined -> True, ImageSize -> Full,
ScalingFunctions -> {"Log10", "Log10"},
PlotStyle -> Array[Hue[(# - 1)/10, 1, Boole[# > 0]] &, 10, 0]]
Code 6.1: Generate the binary compactification k of the digit signature δ of a(n) and store in variable kk. Produce Figure 6.1.
kk = Array[Total@
Map[2^(# - 1) &, DeleteCases[Union[IntegerDigits[a[[#]] ]], 0]] &, 12];
Block[{nn = 10^4, s, t, m = 512},
s = a[[1 ;; nn]];
t = kk[[1 ;; nn]];
ListPlot[
Array[Style[s[[#]], Hue[If[# == 1, 0, t[[# - 1]]]/512]] &, nn],
ImageSize -> 864] ]
Code 6.2: Highlight a particular striation δ (entering it in the variable k where it is written “{1, 2}”) in red on a plot of a(n).
Block[{s, t, nn = 10^4, k = Total@ Map[2^(# - 1) &, {1, 2}], m = -100},
s = ReplacePart[ConstantArray[m, nn],
Map[# + 1 -> a[[# + 1]] &,
Position[kk[[1 ;; nn]], k][[All, 1]]]];
ListPlot[{a[[1 ;; nn]], s[[1 ;; nn]]}, ImageSize -> Large,
AspectRatio -> 1,
PlotRange -> {{0, nn}, {0, Max@ a[[1 ;; nn]]}},
PlotStyle -> {Directive[LightGray, PointSize[Tiny]],
Directive[Red, PointSize[Small]]}] ]
Regarding senary or base-b versions of a(n): the code may be altered to produce datasets; we are not placing code here on account of the fact that the maxima required a long generation time and thus, similar output is not assured. If one desires the code, please contact the author.
Concerns OEIS sequence:
A279818 a(1) = 1, a(n+1) = sum of decimal digits of a(n), plus sum of same digits arising in all prior terms.
Document Revision Record.
2020 1202 2130 First draft.
2020 1203 1200 Second draft.
2020 1203 2100 Publication.
2020 1219 2115 Identification of pandigital
decimal term and data regarding the smallest term of each digit signature.
2020 1222 2145 Addition of data pertaining to repeated terms given the expanded dataset.
2020 1223 1030 Nature of the progenitors of maxima in a(n).